
Spectral Shift is a technique used to study molecular interactions. During detection, one molecule is labeled with a fluorophore. When the fluorescently labeled molecule interacts with a ligand, changes in the chemical environment around the fluorophore cause a shift in its fluorescence emission spectrum. These spectral changes are monitored to determine the occurrence and extent of binding between the molecule and the ligand.
As an emerging technique for detecting molecular interactions, Spectral Shift technology provides high-quality data, sensitively identifies true binding molecules, and delivers reliable sample detection with limited assay optimization.
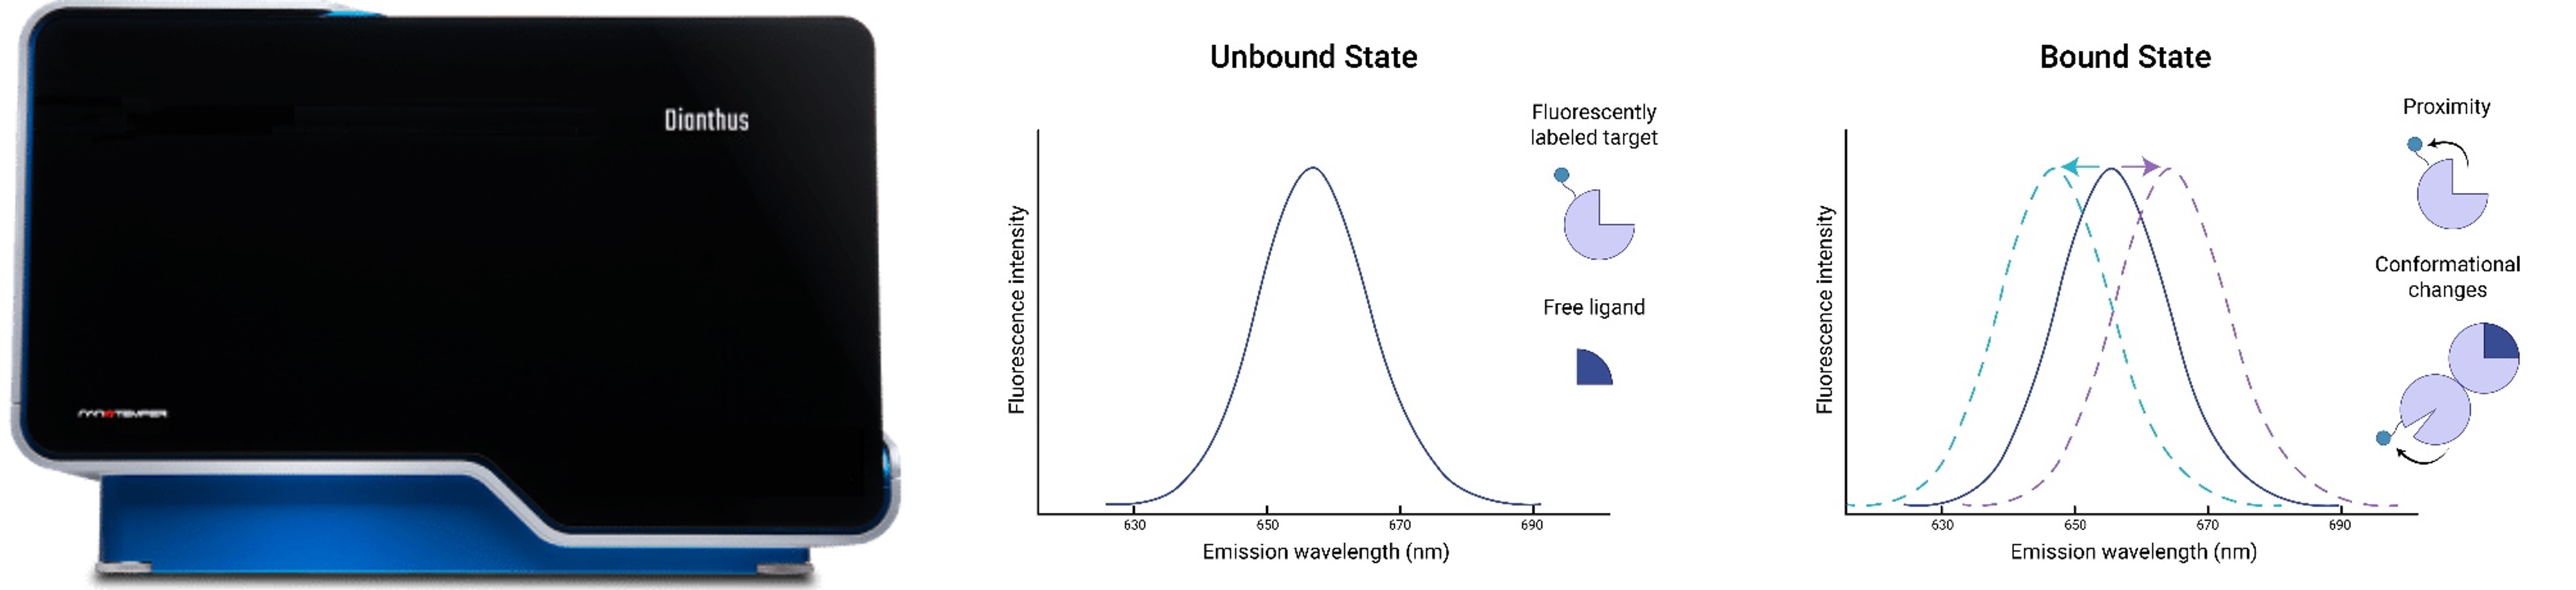
Nanotemper Dianthus and Spectral Shift assay principle. When a target molecule interacts with a ligand, the chemical environment around the fluorophore changes, causing a subtle shift in emission wavelength under isothermal conditions. The fluorescence ratio is determined by simultaneously recording emission at two pre-selected wavelengths, enabling sensitive detection of binding events.
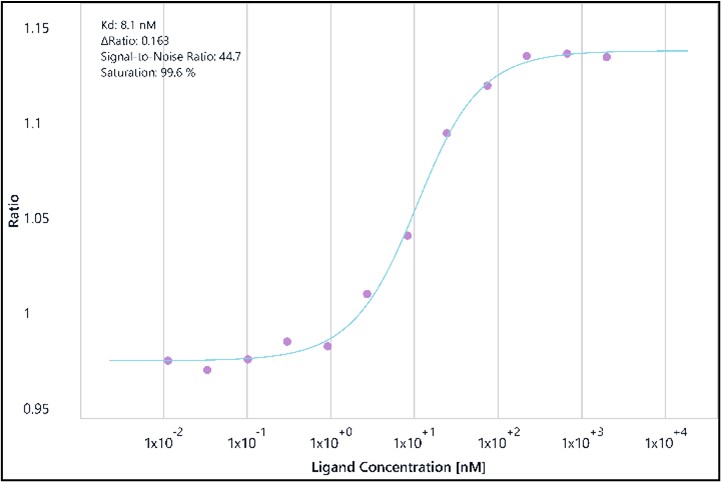
Binding affinity assessment of MZ1, a PROTAC, to BRD2 (BD2) using Spectral Shift technology. The dose–response curve shows the binding interaction between MZ1 and BRD2, yielding a dissociation constant (Kd) of 8.1 nM. Key metrics include an S/B ratio of 0.163, a signal-to-noise ratio of 44.7, and a saturation level of 99.6%, demonstrating a high-affinity binding interaction. BRD2 recognizes acetylated lysines on histones and participates in chromatin remodeling, transcriptional regulation, proliferation, and apoptosis.
We value your inquiries and are here to provide you with tailored solutions for your drug discovery and development needs. Whether you have questions, require more information, or are interested in discussing potential collaborations, our team of experts is just a message away.
Feel free to reach out to us.

Address: Bldg 16, Yd 18, Kechuang 13th St, Etown, Tongzhou Dist, Beijing, 100176, China
Email: marketing@ice-biosci.com
Tel:+86-10-67809840


Get a quote

Go top