The ICESTP Safety Panels™ 44 and 77 are fully functional secondary pharmacology panels designed to deliver quantitative, mechanism-relevant insights. ICESTP 77, in particular, is the first functional Safety 77 panel available in the market. These panels are built on the latest scientific consensus surrounding secondary pharmacology, as outlined in recent publications such as Nature Reviews Drug Discovery (2024). These references emphasize the value of early in vitro profiling to identify off-target liabilities and reduce the risk of late-stage failure due to adverse pharmacology.
ICESTP Safety Panel™ 44
The ICESTP Safety Panel™ 44 reflects the historical core set of off-targets derived from the original Bowes-44 panel, aligned with ICH guidelines and regulatory expectations.
ICESTP Safety Panel™ 77
The ICESTP Safety Panel™ 77 expands this scope through a modern, data-informed target selection strategy, incorporating additional receptors, enzymes, kinases, and transporters relevant to human safety pharmacology. Its design is informed by the IQ DruSafe Safety-77 Core Panel and broader industry efforts to modernize secondary pharmacology screening beyond the historical core panel.
ICESTP Safety Panel™ PLUS
The ICESTP Safety Panel™ PLUS further extends target coverage beyond the Safety 77 framework, incorporating emerging safety-relevant targets across GPCRs, ion channels, kinases, enzymes, and transporters. Designed to address increasing regulatory expectations and complex risk profiles, this panel provides enhanced coverage for both established and newly identified off-target liabilities, enabling a more comprehensive and future-ready safety assessment strategy.
| Target Class | ICESTP Safety Panel™ 44 | ICESTP Safety Panel™ 77 | ICESTP Safety Panel™ PLUS | Custom Panel |
|---|---|---|---|---|
| GPCRs | 24 | 30 (6*) | 41 | Customizable |
| Ion channels | 8 | 8 | 14 | Customizable |
| Enzymes | 6 | 10 (4*) | 18 | Customizable |
| Kinases | 1 | 20 (19*) | 25 | Customizable |
| Transporters | 3 | 4 (1*) | 4 | Customizable |
| Nuclear receptors | 2 | 5 (3*) | 6 | Customizable |
| No. of Targets | 44 | 77 | 108 | Up to 140+ targets |
| No. of Assays | 74 | 116 | 162 | Flexible |
* Numbers in parentheses indicate new targets added in ICESTP Safety Panel™ 77 compared to Panel 44.
Functional assays go beyond simple binding—they generate actionable pharmacological data by measuring real cellular or biochemical responses. Compared to single-point binding assays, functional screening provides greater predictive value, helping uncover true off-target effects, including agonist or allosteric activity that binding assays might miss.
That's why all ICESTP Safety Panels™ are available in both single-concentration and full dose–response formats. With dose–response profiling, we deliver quantitative IC₅₀/EC₅₀ values that not only improve data confidence but also help distinguish true activity from background noise, solubility limitations, or non-specific binding.
Why Dose–Response Profiling Matters
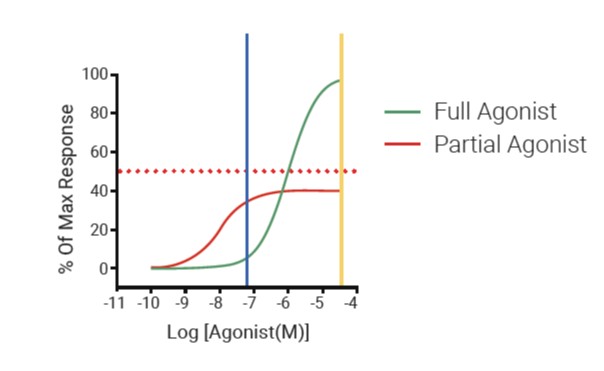
Distinguish Full vs Partial Agonism
Only dose–response curves can reveal whether a compound is a full or partial agonist. Single-point data may miss functional nuances critical for risk prediction.
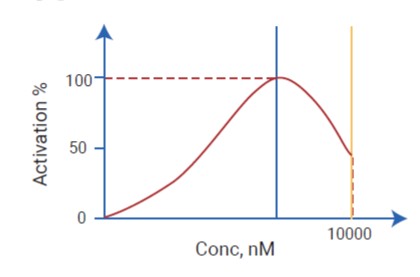
Identify Non-Linear Effects
Some targets show bell-shaped dose–response curves. Without full profiling, these effects may be misinterpreted or overlooked entirely.
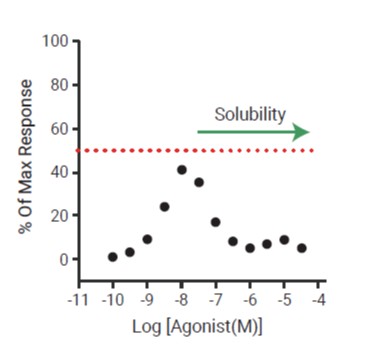
Avoid Solubility-Driven Misreads
Apparent activity loss at higher doses could result from solubility issues, not biology. Dose–response testing helps differentiate real effects from artifacts.
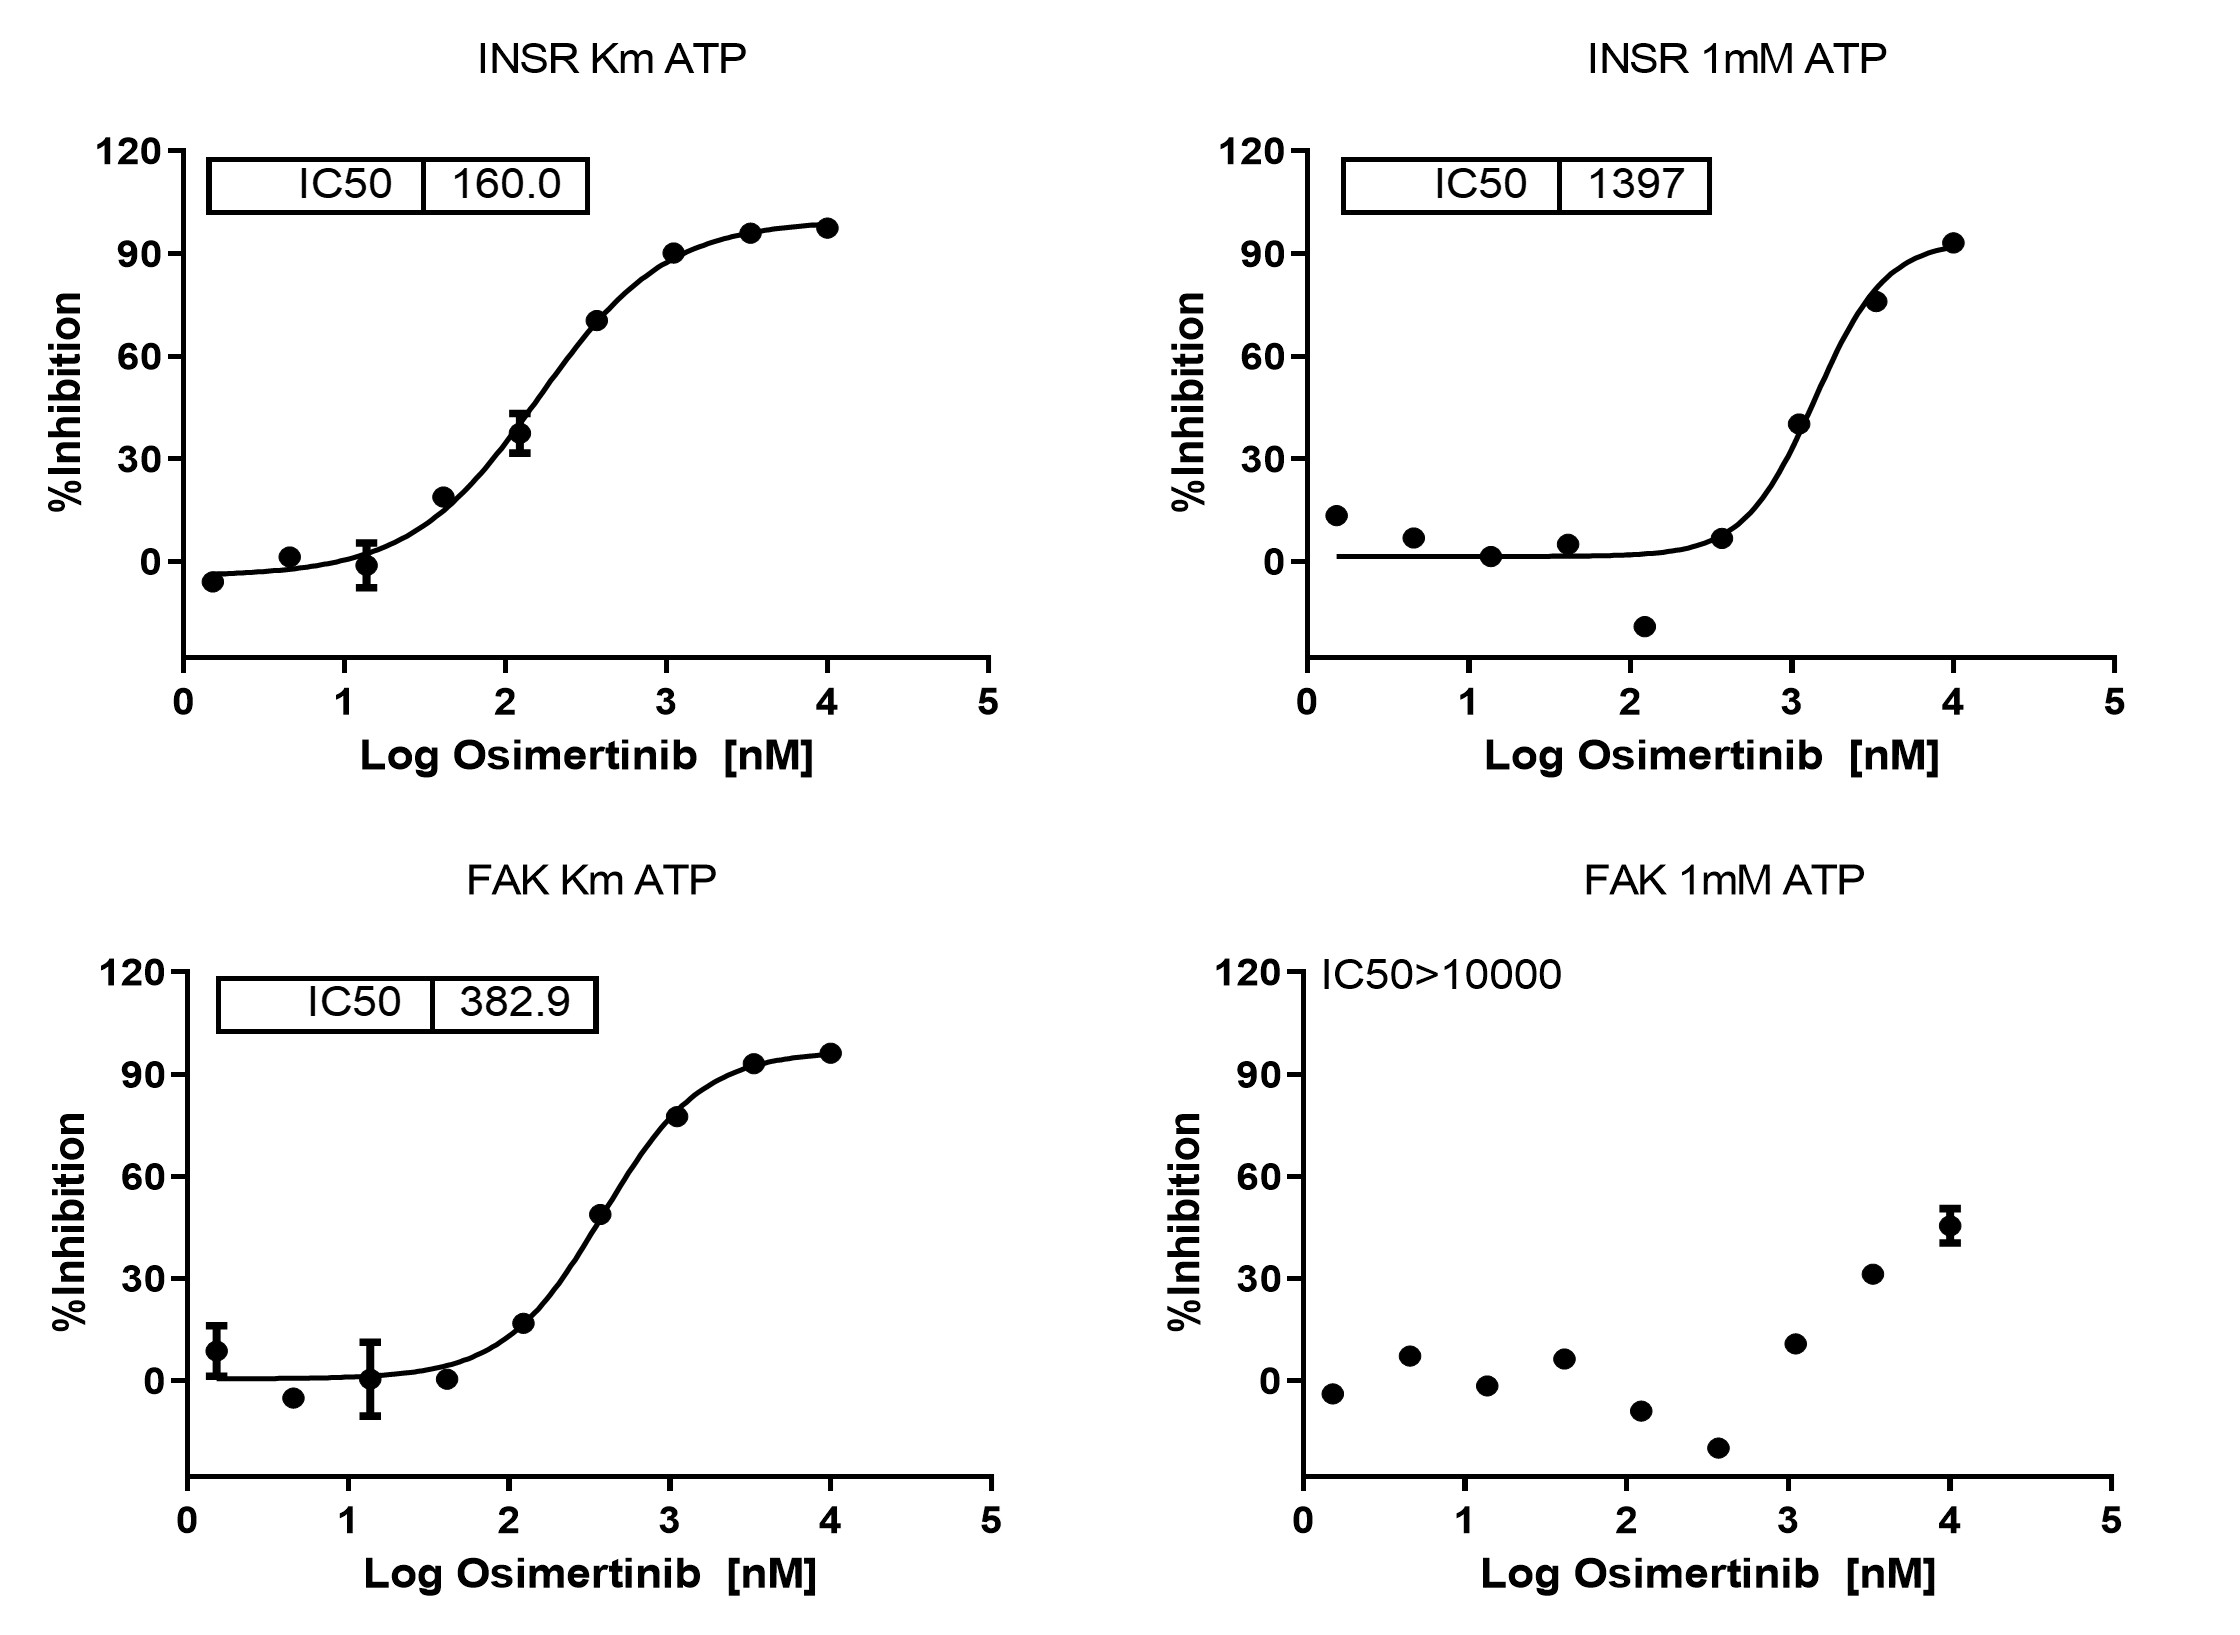
Functional Kinase Profiling Under Physiological ATP Conditions
All kinase targets in the ICESTP Safety Panels™ are profiled using 1 mM ATP, reflecting near-physiological intracellular ATP levels. This decision is based on the understanding that most binding- or low-ATP-based assays may overestimate kinase inhibition, particularly for ATP-competitive compounds. It can filter out compounds that appear active only under low ATP conditions but show weak or no activity under physiological ATP levels—reducing false positives.
What Makes ICESTP Panels Different
Dual Replicates at Top Dose
Highest concentration point is tested in duplicate to ensure data consistency and reproducibility—especially for borderline signals.
Dual Data Visualizations
Each panel includes a radar chart of top-dose activity and IC₅₀/EC₅₀ curves across all targets—for quick pattern recognition and deep dive analysis.
Two Panel Options
Whether for early exploratory screening or pre-IND safety evaluation, ICESTP 44 and 77 cover different decision-making needs across preclinical stages.
1 mM ATP in Kinase Profiling
All kinase assays are performed at 1 mM ATP to reflect physiological conditions, minimizing false positives and improving translational relevance.
Visual Reports with Expert Interpretation
Study reports combine visualization and raw data for fast decision-making—ready to share with project teams or for regulatory documentation.
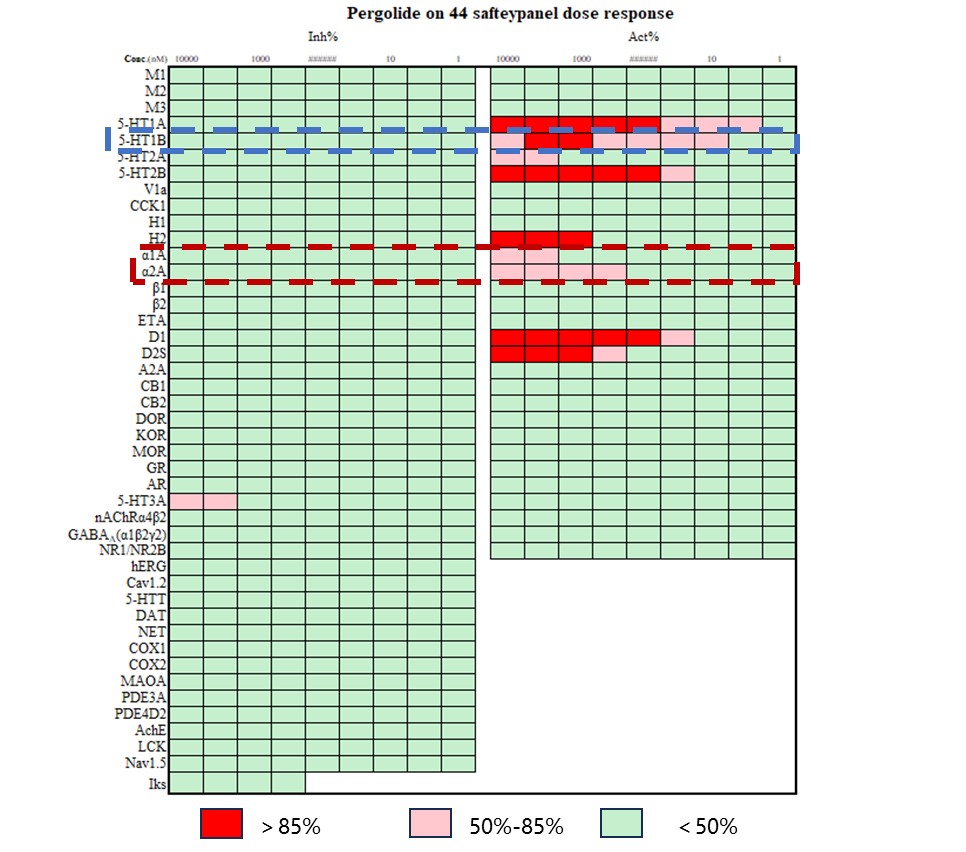
Dose–response profiling reveals nuanced pharmacological behavior not captured by single-point assays. 5-HT1B (blue box) shows a bell-shaped curve—only detectable through full concentration profiling. α1A and α2A (red box) display partial agonist activity, with submaximal effects even at the highest dose.
We value your inquiries and are here to provide you with tailored solutions for your drug discovery and development needs. Whether you have questions, require more information, or are interested in discussing potential collaborations, our team of experts is just a message away.
Feel free to reach out to us.
Address: Bldg 16, Yd 18, Kechuang 13th St, Etown, Tongzhou Dist, Beijing, 100176, China
Email: marketing@ice-biosci.com
Tel:+86-10-67809840