Broad binding panels are widely used to identify affinity at defined target sites, but target occupancy alone does not establish whether an interaction produces activation or inhibition. Functional profiling adds this pharmacological direction and can reveal response-modifying activity that may not be captured by ligand displacement alone.[1,2]
This study applies the ICESTP Safety Panel™ PLUS ↗ to four antidepressants representing distinct pharmacological classes. A common 108-target functional framework enables direct comparison of response breadth, direction, and concentration dependence while retaining compound-level differences that may be obscured by therapeutic-class labels.
Antidepressants provide a useful setting for investigating the relationship between pharmacological selectivity and clinical risk. Drugs developed for the same therapeutic purpose can differ substantially in receptor activity, ion-channel interactions, active metabolites, exposure profiles, and adverse-effect patterns. Comparing representative compounds in one assay framework therefore provides a way to examine how these differences appear at the molecular level.
Amitriptyline is a tricyclic antidepressant that combines serotonin and norepinephrine reuptake inhibition with broader receptor and ion-channel pharmacology. Its prescribing information includes drowsiness and anticholinergic effects, as well as orthostatic hypotension, conduction changes, heart block, and arrhythmias.[3] These clinically recognized effects provide a reference for evaluating whether a broad functional profile recovers a coherent multi-target liability pattern.
Fluoxetine and citalopram are selective serotonin reuptake inhibitors with more focused primary pharmacology, but their clinical risk profiles are not identical. Fluoxetine labeling reports QT prolongation and ventricular arrhythmia, and direct inhibition of the cardiac Nav1.5 channel has been demonstrated experimentally.[4,5] Citalopram carries a specific warning for dose-dependent QTc prolongation associated with Torsades de Pointes, ventricular tachycardia, and sudden death.[6] Their inclusion allows compounds from the same therapeutic class to be compared without assuming equivalent secondary pharmacology.
Bupropion provides a mechanistically distinct comparison centered on norepinephrine and dopamine signaling. Its clinically important warnings include dose-related seizure risk and elevated blood pressure.[7] These risks are useful for examining whether a restricted broad-panel profile necessarily corresponds to an absence of clinically relevant safety considerations.
Together, the four compounds span a progression from broad multi-target pharmacology to more focused transporter mechanisms. The central research question is whether this progression is reflected in their functional off-target profiles and whether the observed molecular patterns remain consistent with their known, compound-specific clinical risk characteristics.
Amitriptyline, citalopram, fluoxetine, and bupropion were first compared at 10 μM in a common 108-target functional landscape. Radar plots provided a compact view of activation and inhibition across the full panel. Dose-response heatmaps were then used to examine the concentration-resolved profiles of amitriptyline and bupropion across the same 108 targets.
The four radar plots use the same 108-target coordinate system. The blue trace represents activation, the orange trace represents inhibition, and the red reference ring marks 50% response. This view supports pattern comparison at one concentration; it does not provide an IC50, EC50, exposure margin, or standalone clinical safety conclusion.
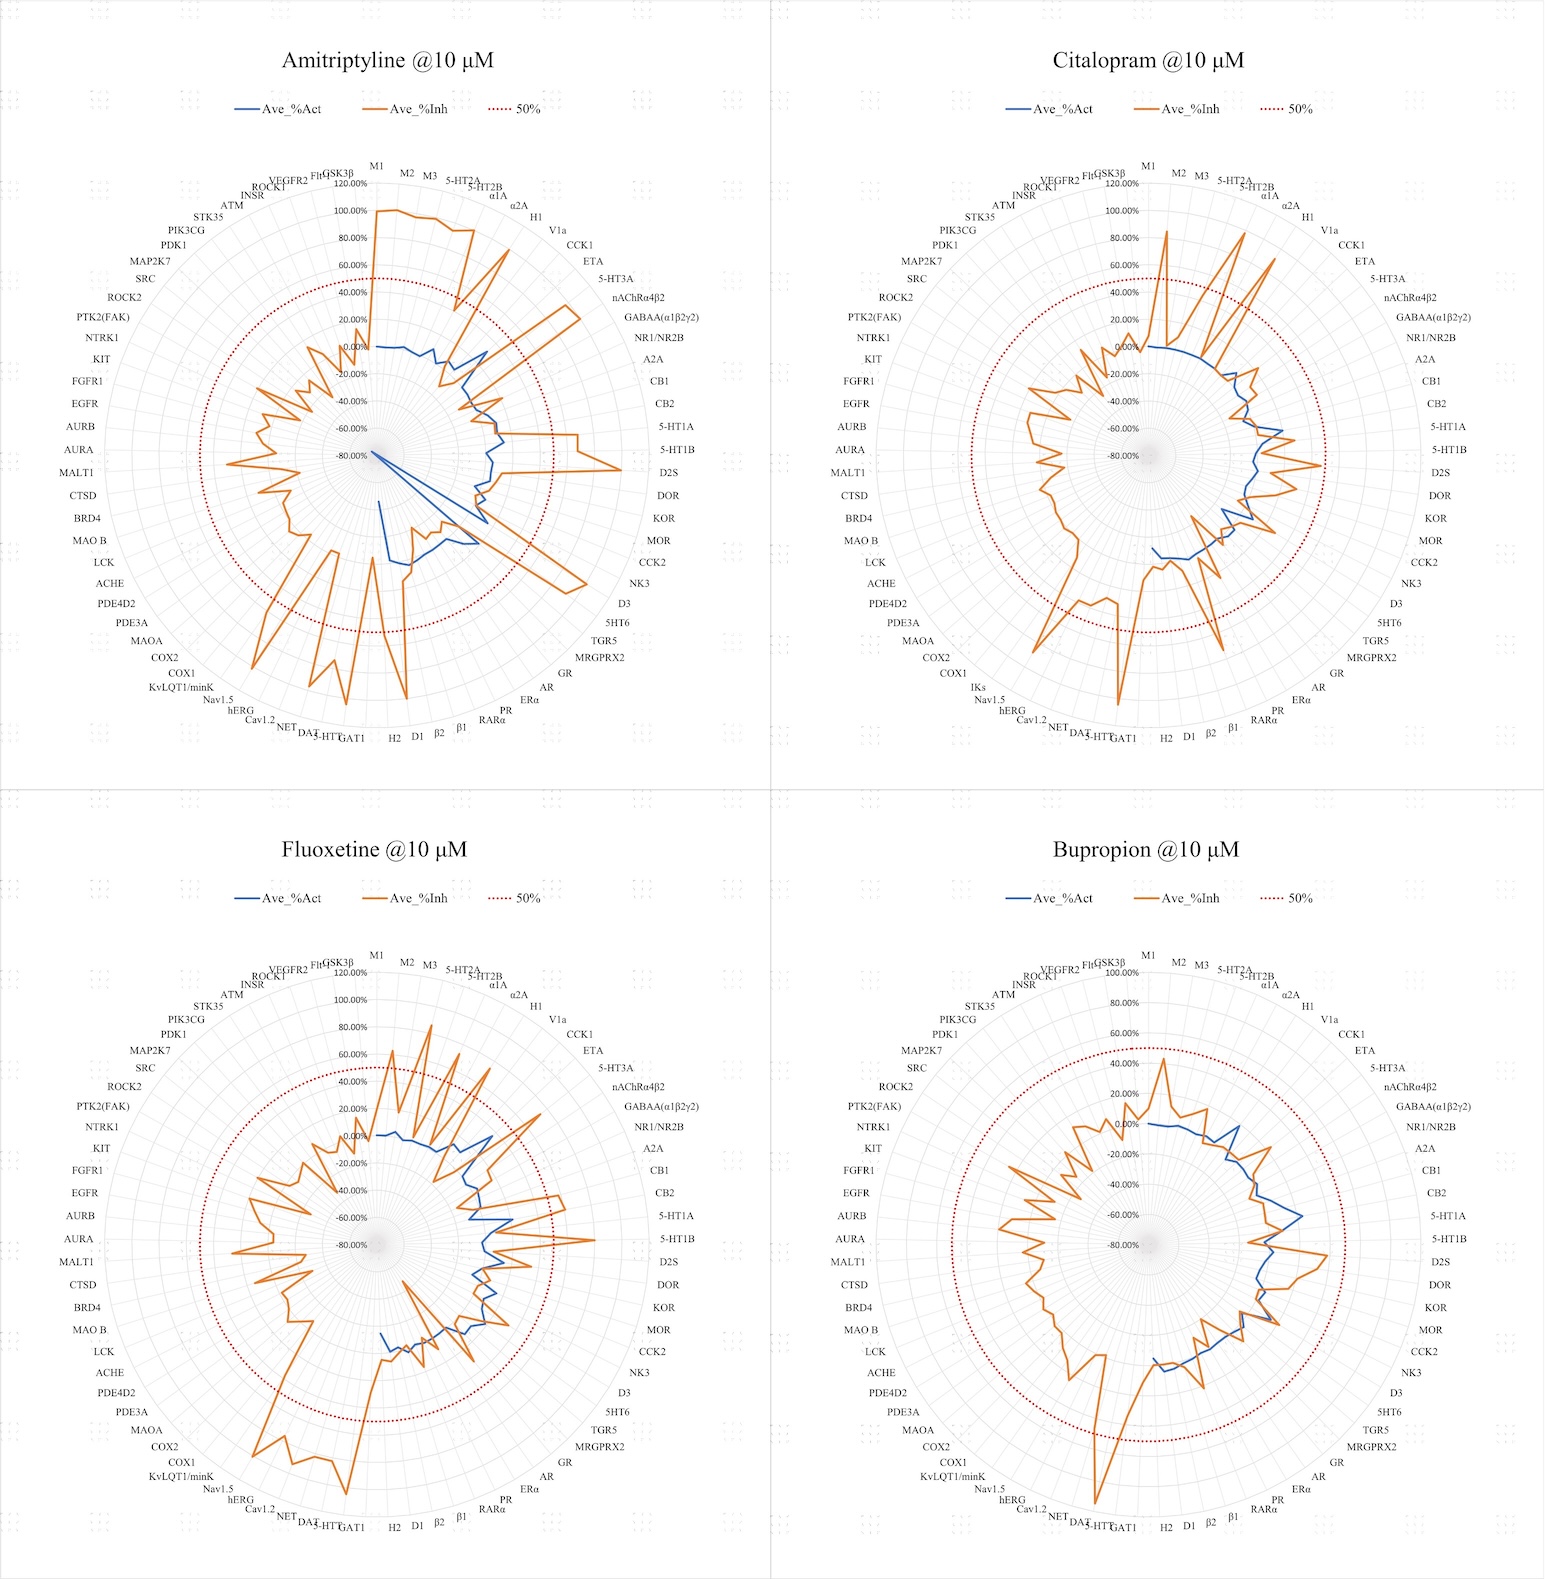
Figure 1. Functional profiles of amitriptyline, citalopram, fluoxetine, and bupropion across the 108-target ICESTP Safety Panel™ PLUS at 10 μM.
None of the four compounds produced an activation response at or above 50% in the tested activation modes at 10 μM. The main difference between compounds therefore lies in the breadth and identity of inhibition responses. Amitriptyline shows the widest functional footprint, citalopram and bupropion show more restricted profiles, and fluoxetine demonstrates that meaningful secondary pharmacology can remain within a therapeutically selective class.
A radar plot compresses every target into one value at one concentration. Dose-response profiling restores the concentration dimension and helps distinguish persistent pharmacology from responses that appear only near the highest tested concentration. It also preserves partial activity and non-linear behavior that can disappear when the data are converted to a binary hit or non-hit classification.
The heatmaps separate inhibition and activation modes, organize targets by family, and display measured mean responses using four intervals: below 25%, 25% to below 50%, 50% to below 75%, and 75% or above. N/T denotes a concentration or mode that was not tested; no untested values were interpolated or replaced with zero.
The heatmap shows that multiple prominent responses extend across adjacent concentrations, rather than appearing as isolated top-concentration observations. Other responses are restricted to the upper end of the tested range, allowing persistent pharmacology to be separated from weaker or high-concentration effects.
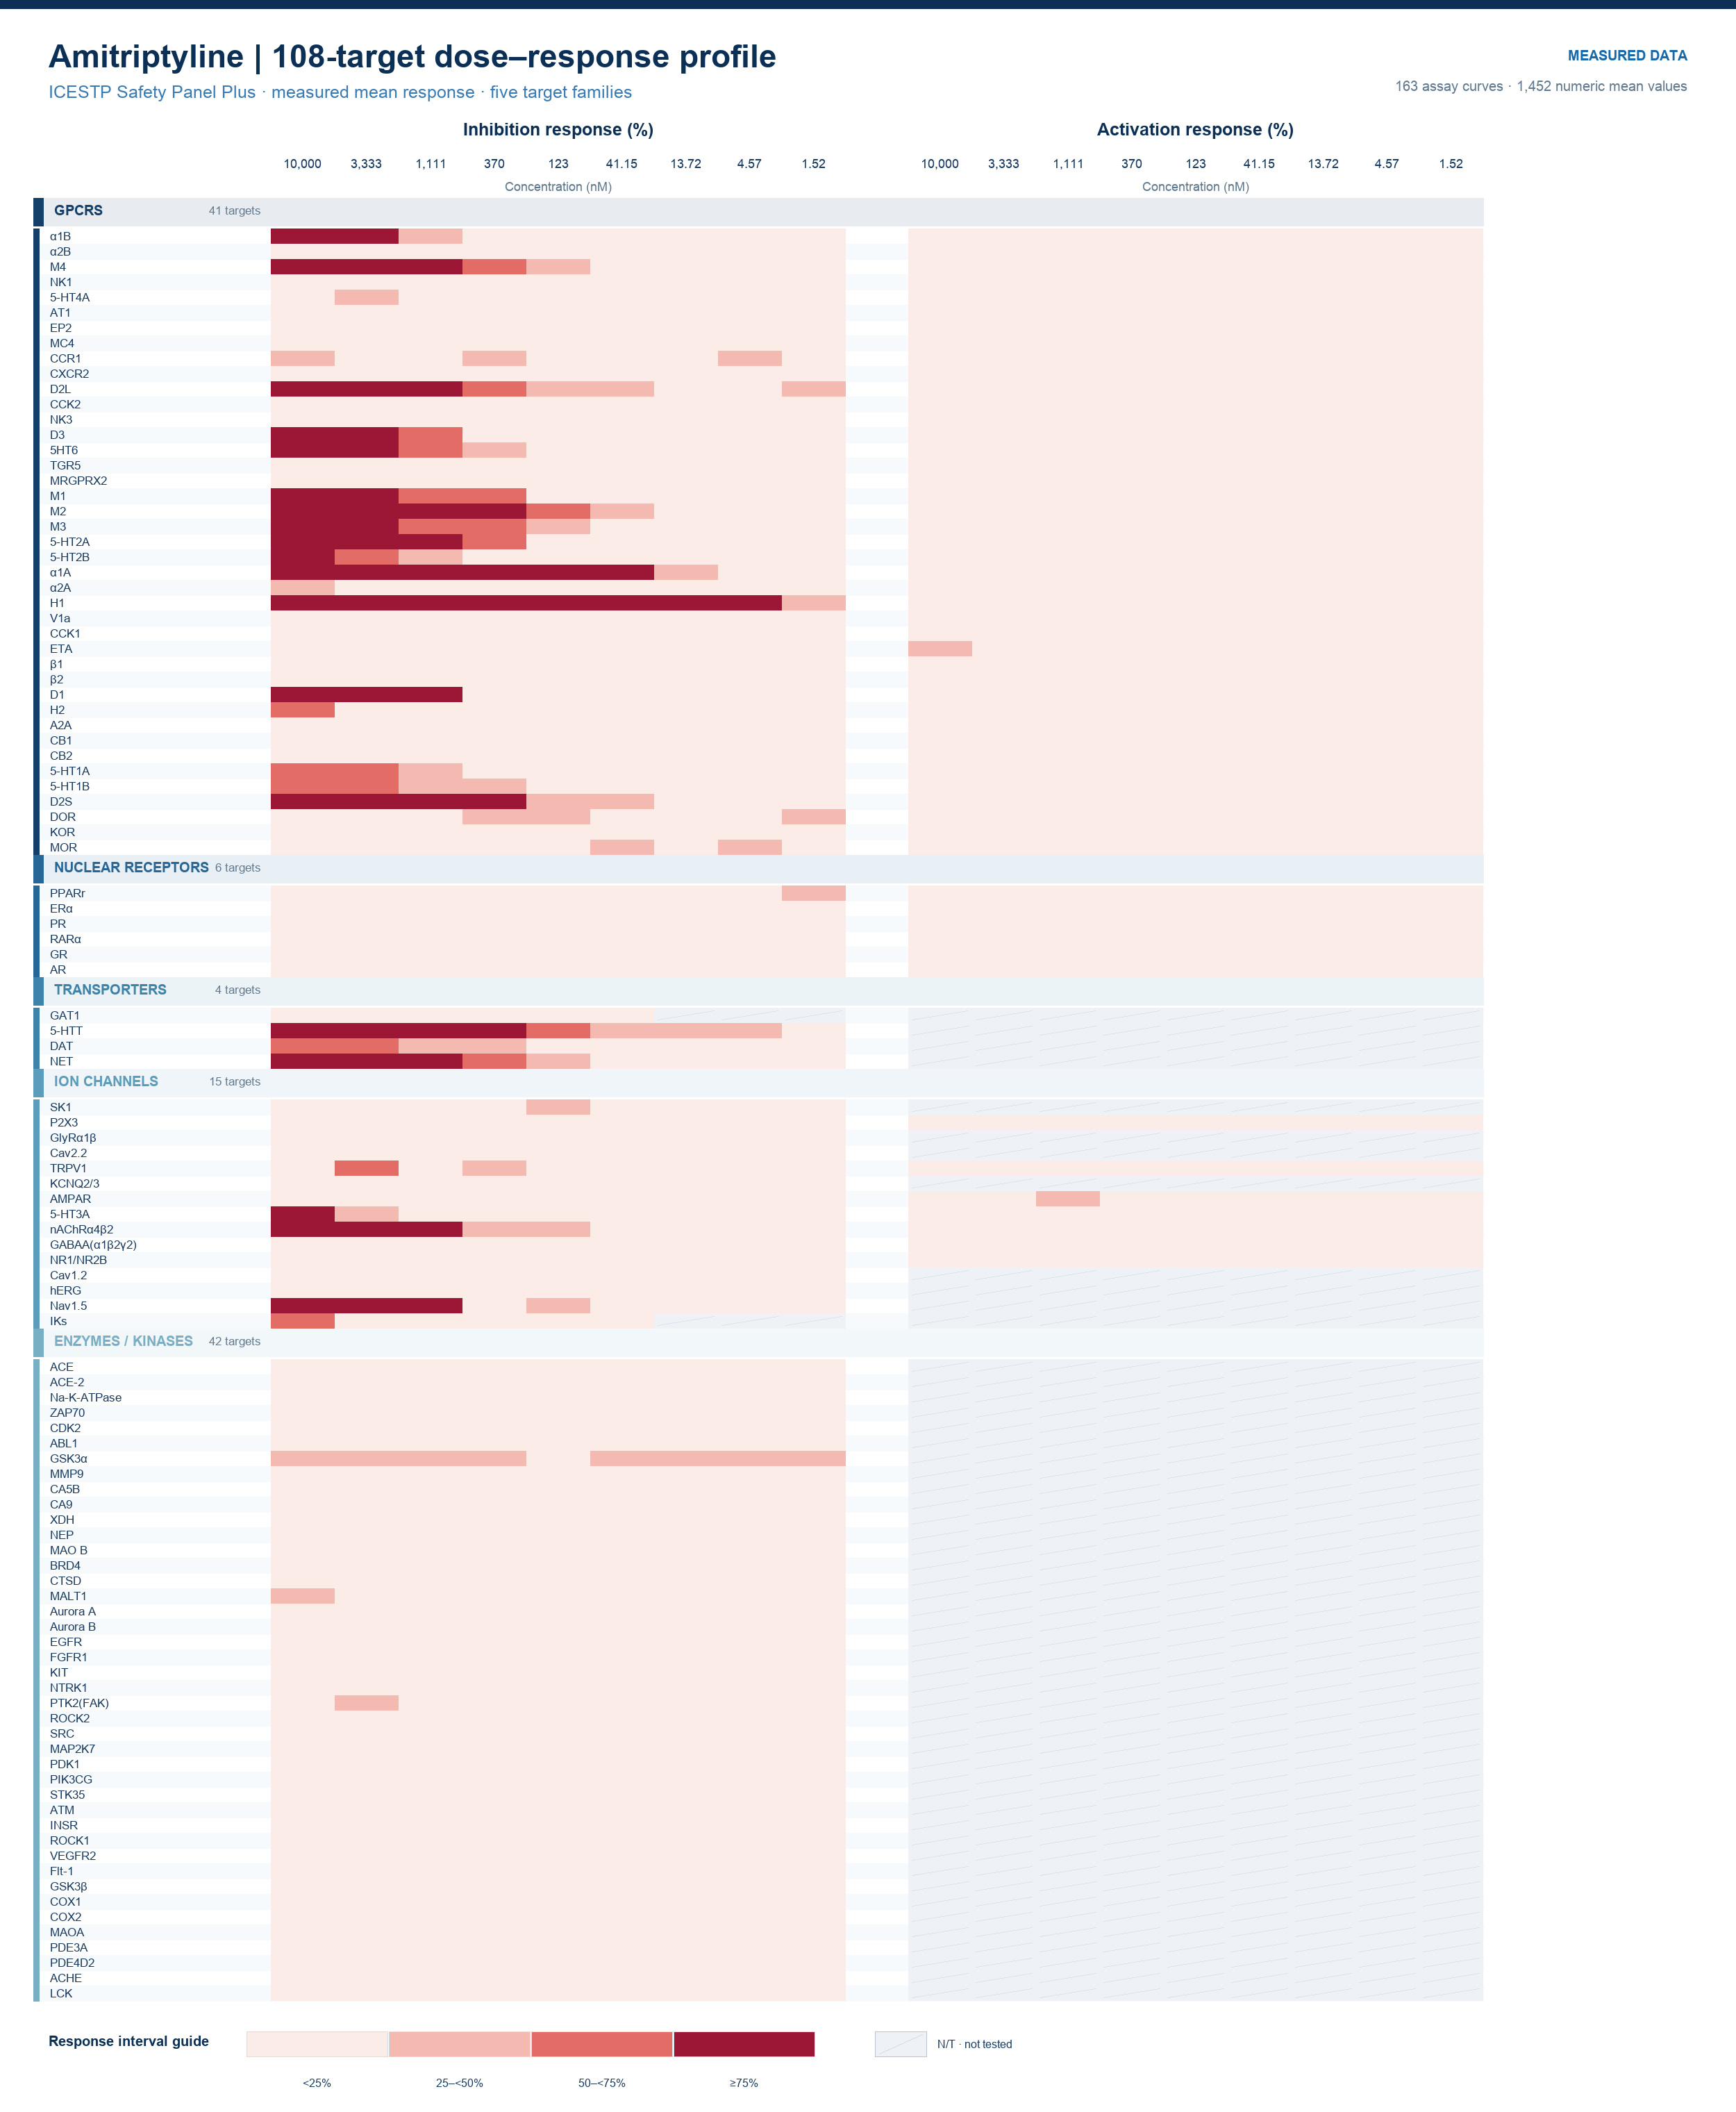
Figure 2. Amitriptyline 108-target dose-response heatmap. Measured inhibition and activation responses are shown across the tested concentration series and grouped into five visualization families.
Although only DAT exceeds 50% inhibition in the 10 μM radar comparison, the heatmap retains the complete continuous response landscape. Lower-amplitude and mode-specific responses remain visible without being promoted to definitive hits, providing a more faithful basis for curve review and exposure-margin assessment.
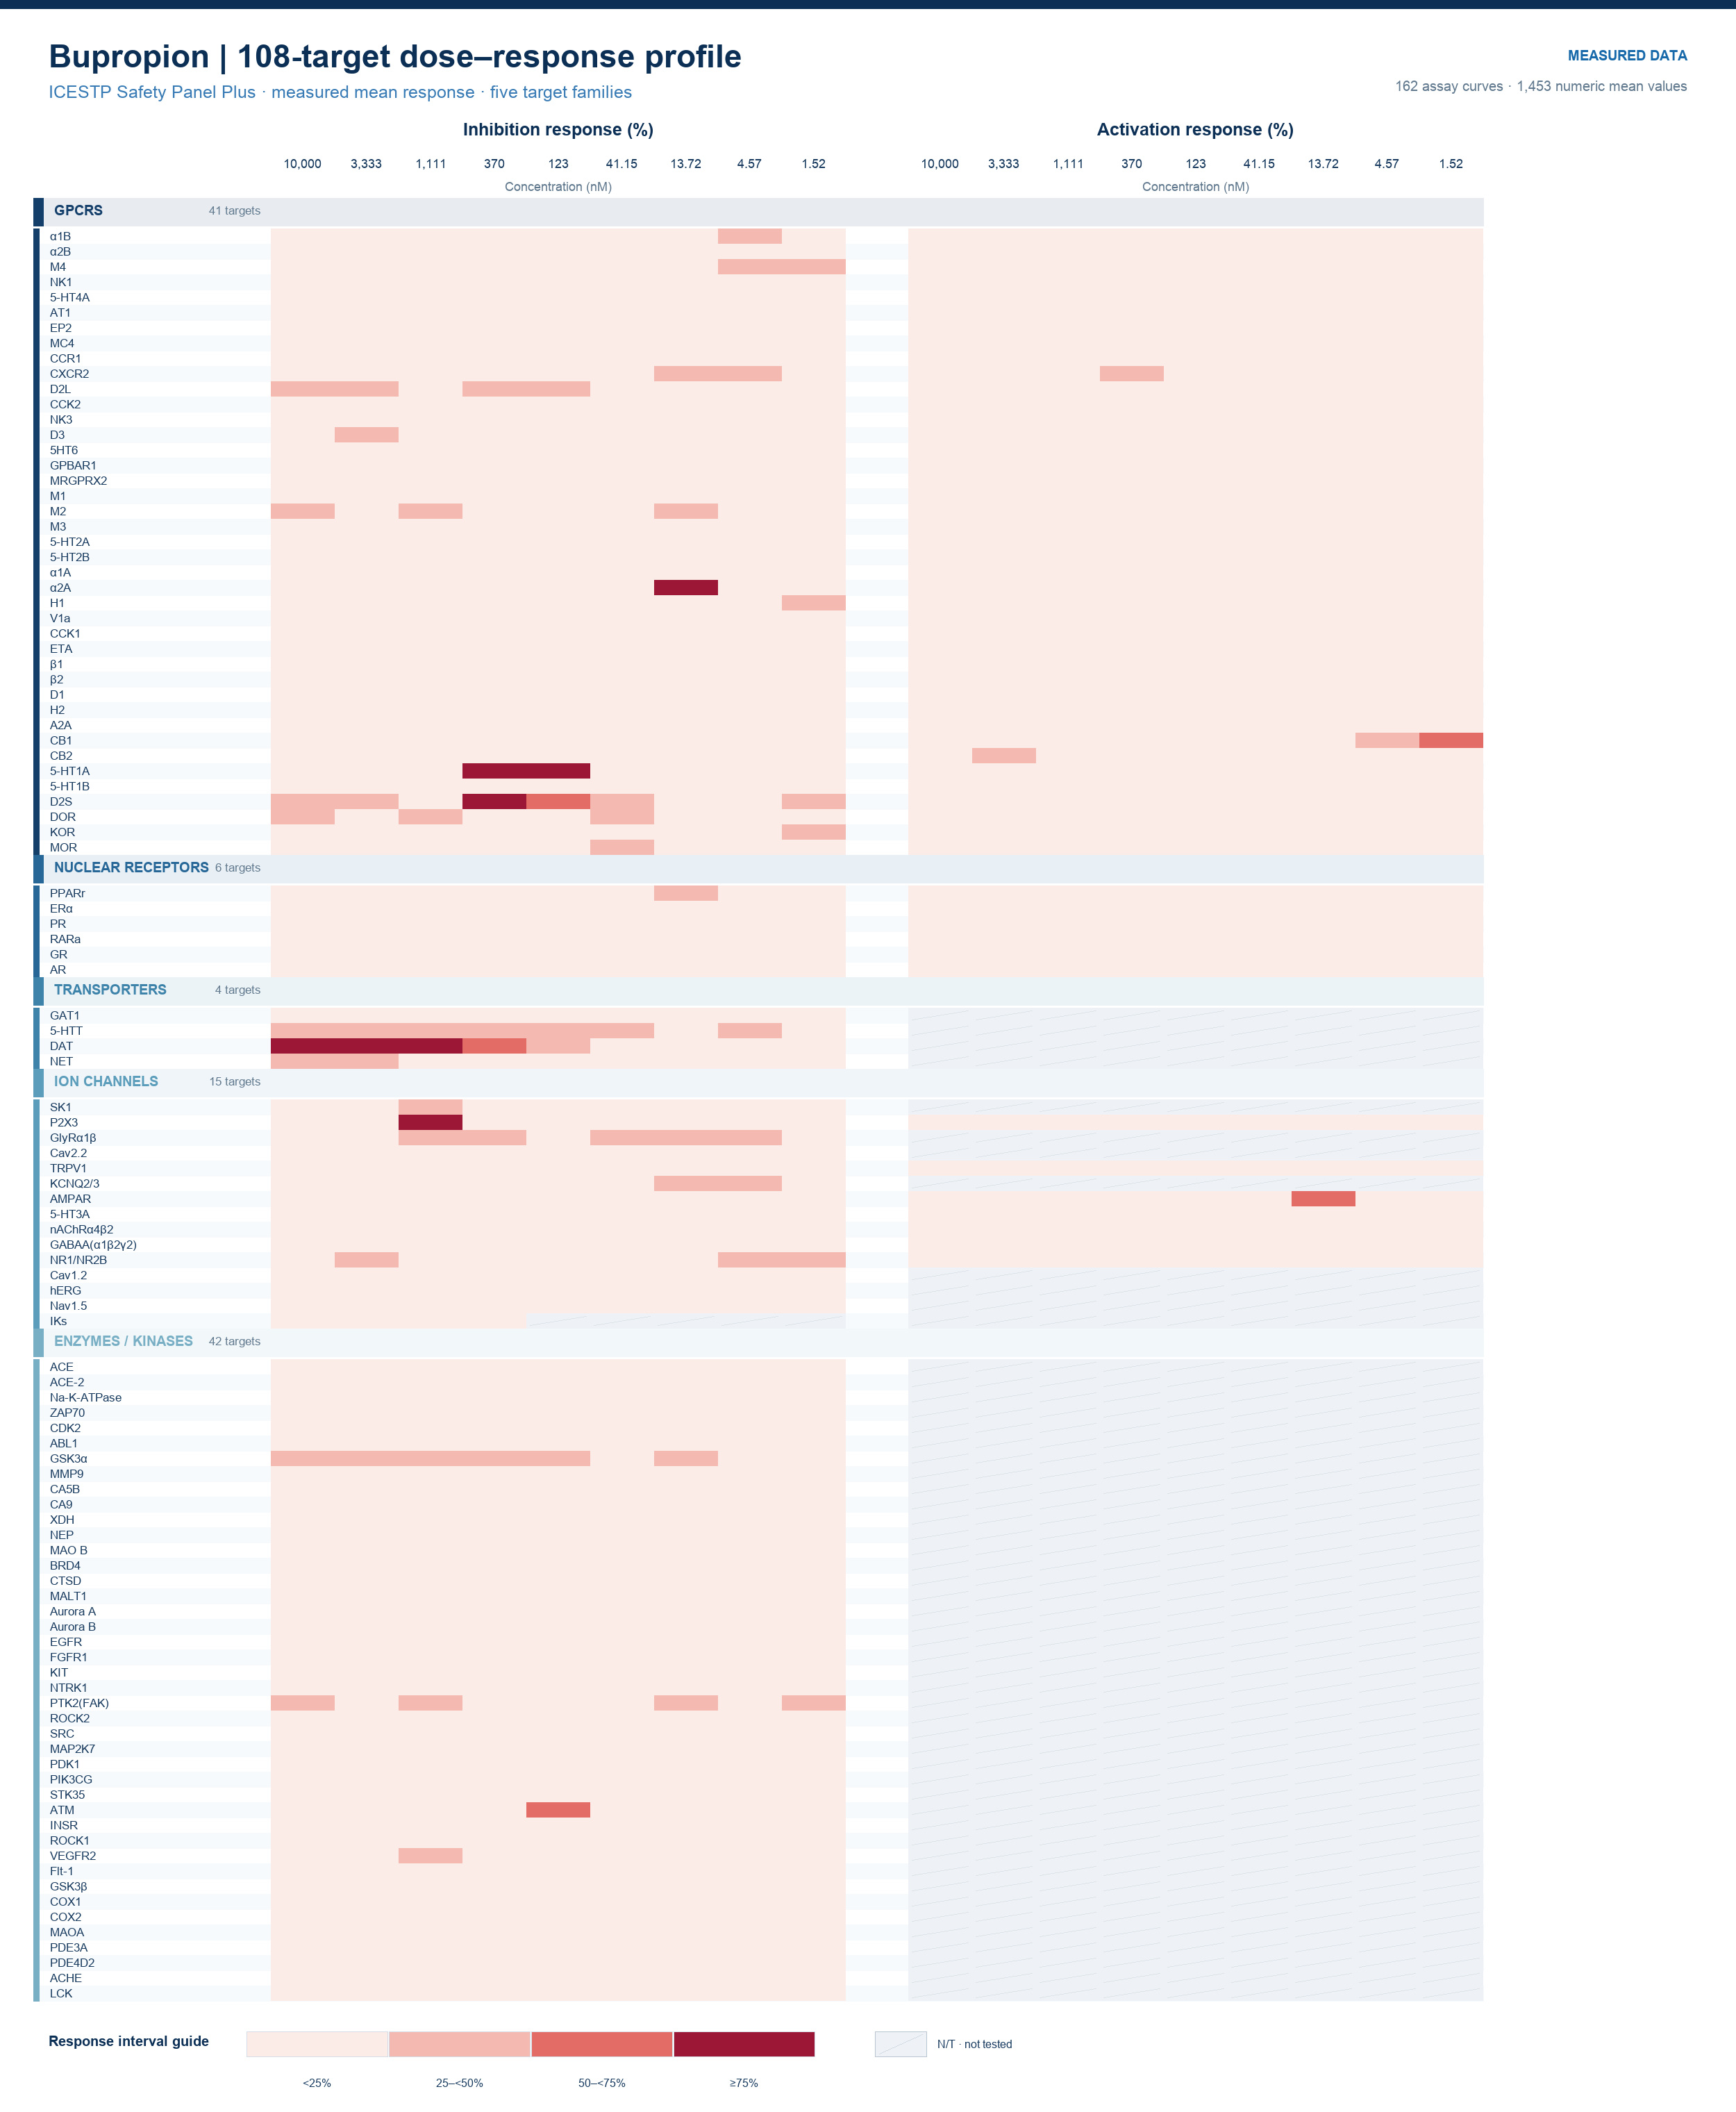
Figure 3. Bupropion 108-target dose-response heatmap. The continuous display preserves concentration-dependent information below the 50% radar threshold and distinguishes measured values from N/T conditions.
Data interpretation note: Heatmaps display measured responses at each tested concentration. Isolated non-monotonic values were interpreted conservatively and were not considered confirmed concentration-dependent activity without curve-level reproducibility.
The four antidepressants illustrate a shift from broad receptor and ion-channel pharmacology toward more focused functional profiles, but they also show that improved selectivity changes the pattern of risk rather than eliminating risk. Amitriptyline produces the broadest and most clinically recognizable off-target landscape. Fluoxetine retains a distinct cardiac ion-channel signature despite belonging to a selective therapeutic class. Citalopram demonstrates the limitations of a fixed 50% threshold, and bupropion demonstrates the limitations of equating a restricted panel footprint with the absence of clinically important liabilities. Used in this context, Safety Panel Plus functions as an early mechanistic risk map: it prioritizes target-mediated signals, supports quantitative follow-up, and indicates when a question must move beyond a broad panel into exposure analysis or dedicated safety models.
1. Bowes J, Brown AJ, Hamon J, Jarolimek W, Sridhar A, Waldron G, Whitebread S. Reducing safety-related drug attrition: the use of in vitro pharmacological profiling. Nature Reviews Drug Discovery. 2012;11(12):909-922. doi:10.1038/nrd3845.
2. Brennan RJ, Jenkinson S, Brown A, et al. The state of the art in secondary pharmacology and its impact on the safety of new medicines. Nature Reviews Drug Discovery. 2024;23:525-545. doi:10.1038/s41573-024-00942-3.
3. U.S. National Library of Medicine. Amitriptyline hydrochloride tablets: prescribing information. DailyMed.
4. U.S. National Library of Medicine. Fluoxetine capsules: prescribing information. DailyMed.
5. Poulin H, Bruhova I, Timour Q, et al. Fluoxetine blocks Nav1.5 channels via a mechanism similar to that of class 1 antiarrhythmics. Molecular Pharmacology. 2014;86(4):378-389. doi:10.1124/mol.114.093104.
6. U.S. National Library of Medicine. Citalopram tablets: prescribing information. DailyMed.
7. U.S. National Library of Medicine. Bupropion hydrochloride tablets: prescribing information. DailyMed.
PREV:126 Dual Payload Pairs Screening Identif...
NEXT:There's no more
2026-07-03
2026-05-22
2026-05-21
2026-05-13
We value your inquiries and are here to provide you with tailored solutions for your drug discovery and development needs. Whether you have questions, require more information, or are interested in discussing potential collaborations, our team of experts is just a message away.
Feel free to reach out to us.

Address: Bldg 16, Yd 18, Kechuang 13th St, Etown, Tongzhou Dist, Beijing, 100176, China
Email: marketing@ice-biosci.com
Tel:+86-10-67809840


Get a quote

Go top