From behavioral screening to pathway profiling
Selecting a mouse model of depression requires alignment between the proposed mechanism of action, the behavioral domain of interest, and the time needed to detect a treatment response. Chronic unpredictable mild stress (CUMS), chronic social defeat stress (CSDS), and learned helplessness (LH) provide complementary approaches to investigating stress-related behavioral changes.
This application note compares their use in antidepressant research and presents ICE Bioscience's CUMS workflow . The case illustrates how phenotype-based enrollment, pretreatment group balancing, and reference-drug testing support efficacy evaluation. Molecular, cellular, and imaging measurements then extend the behavioral findings into a more detailed characterization of the model.
CUMS, CSDS, and LH emphasize different behavioral domains and place different demands on study duration. Table 1 summarizes their induction periods, phenotype-positive yields, and representative mechanisms to support model selection.[1–3]
Table 1. Characteristics and research applications of three mouse models of depression.
CUMS, chronic unpredictable mild stress; CSDS, chronic social defeat stress; LH, learned helplessness; TST, tail suspension test; FST, forced swim test; SERT, serotonin transporter; NET, norepinephrine transporter; VTA, ventral tegmental area; NAc, nucleus accumbens.
Mechanistic interpretation also depends on anatomical context. Mesolimbic BDNF signaling contributes to susceptibility to social defeat, whereas the CUMS case below examines neurotrophic signaling in the prefrontal cortex and hippocampus.[5,7]
CUMS exposes mice to a changing sequence of stressors over several weeks to produce behavioral changes associated with chronic stress. The construction strategy and subsequent behavioral assessments are illustrated in Figure 1. In the present platform, induction commonly requires 4–8 weeks, making CUMS a relatively long and labor-intensive model compared with CSDS or LH (Table 1).[1,10]
Substantial variation between laboratories is a central challenge for CUMS. Differences in mouse strain, sex, housing, stressor composition, exposure intensity, and testing conditions can change the magnitude and timing of the phenotype. Published mouse protocols emphasize careful control of these conditions, and direct strain comparisons have demonstrated different responses to the same CUMS procedure.[1,10,11] A defined stress schedule, consistent handling, and documented environmental conditions are therefore important for establishing a reproducible local protocol.
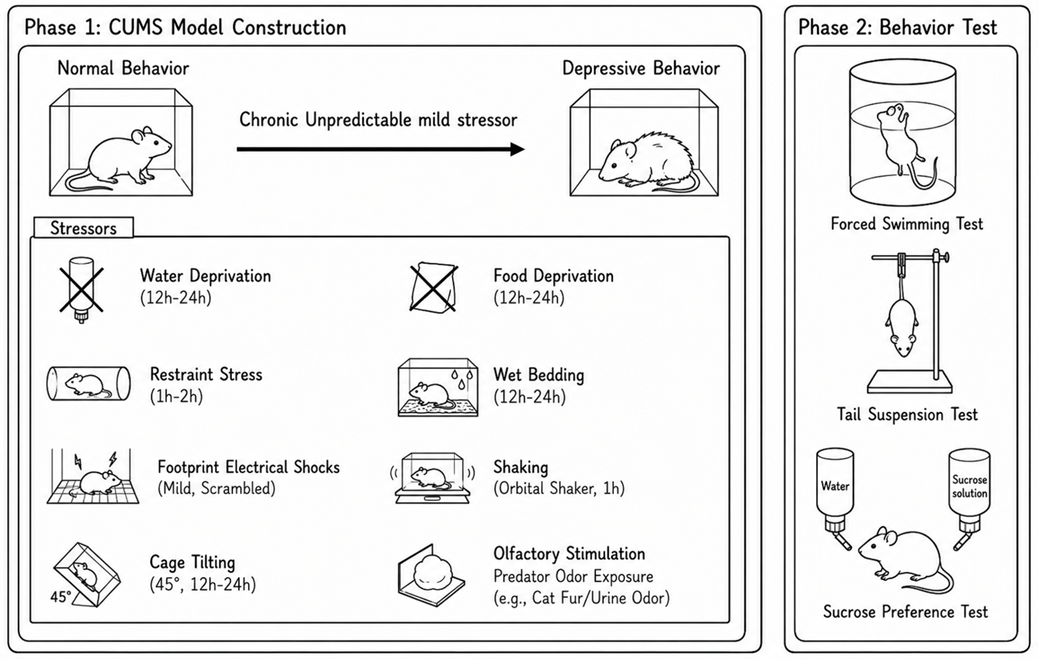
Figure 1. CUMS induction and behavioral assessment strategy. The schematic illustrates exposure to an unpredictable sequence of stressors, followed by behavioral assessment using the forced swim test, tail suspension test, and sucrose preference test. Stressor types and exposure durations are indicated.
After CUMS induction, behavioral screening is performed before treatment allocation to establish a measurable phenotype and reduce variation in starting severity. The representative qualification dataset uses the tail suspension test (TST), which quantifies immobility during suspension and was developed as an antidepressant-sensitive behavioral assay.[12] Figure 2 shows the TST results before and after enrollment screening.
Both the prescreening and postscreening CUMS cohorts showed significantly longer TST immobility than unstressed controls (Figure 2). The selected cohort therefore retained the stress-associated behavioral phenotype before treatment. These cohort-level comparisons support phenotype qualification; comparable pretreatment severity across treatment arms is addressed during allocation.
Eligible mice are subsequently stratified by pretreatment TST immobility and randomized across the model/vehicle and treatment groups to obtain comparable distributions of baseline severity. Prespecified enrollment criteria, consistent scoring, and defined intervals between screening and subsequent testing help control variation in the efficacy study.
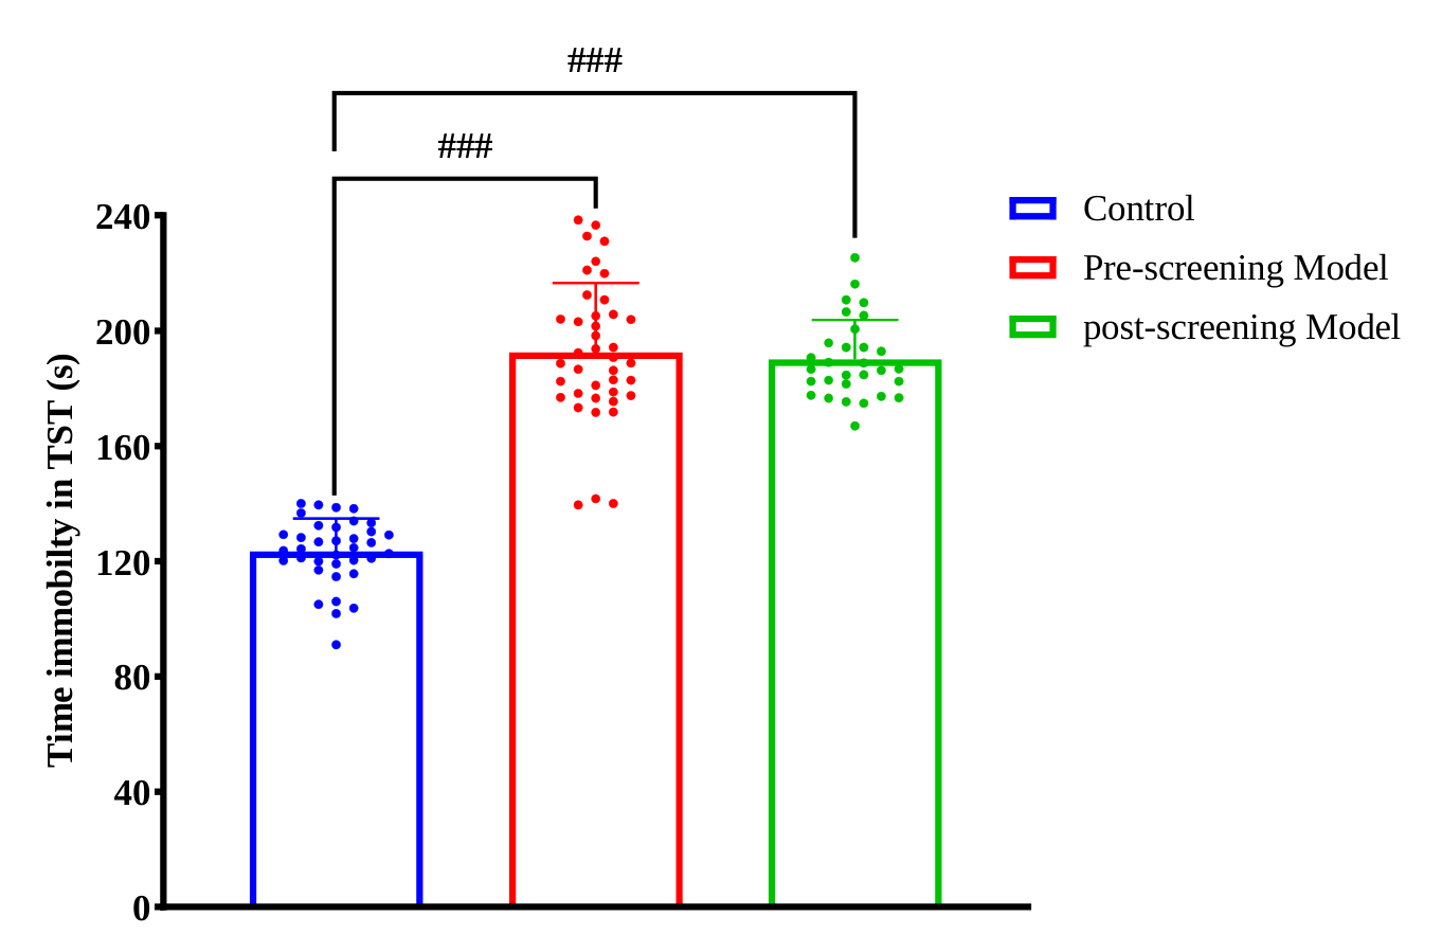
Figure 2. TST-based qualification of CUMS-exposed mice before treatment. TST immobility time (s) is shown for unstressed controls, the CUMS cohort before screening, and the selected CUMS cohort after screening. Points represent individual observations. Brackets indicate comparisons of each CUMS cohort with the control group. TST, tail suspension test.
Reference compounds with different response profiles were evaluated at the doses and assessment times summarized in Table 2. Their behavioral effects are shown in Figure 3.
Table 2. Reference compounds and behavioral assessment conditions in CUMS mice.
Doses and time points correspond to the displayed case-study experiments. SSRI, selective serotonin reuptake inhibitor; SNRI, serotonin–norepinephrine reuptake inhibitor.
(S)-Ketamine significantly increased sucrose preference and reduced FST and TST immobility 1 h after treatment relative to the CUMS model group (Figure 3A). Psilocybin significantly increased sucrose preference and reduced FST immobility at 24 h (Figure 3B). Fluoxetine and venlafaxine each significantly improved both endpoints after 15 days of treatment (Figure 3C). These findings demonstrate antidepressant-like responses to agents assessed at early time points and after repeated treatment.
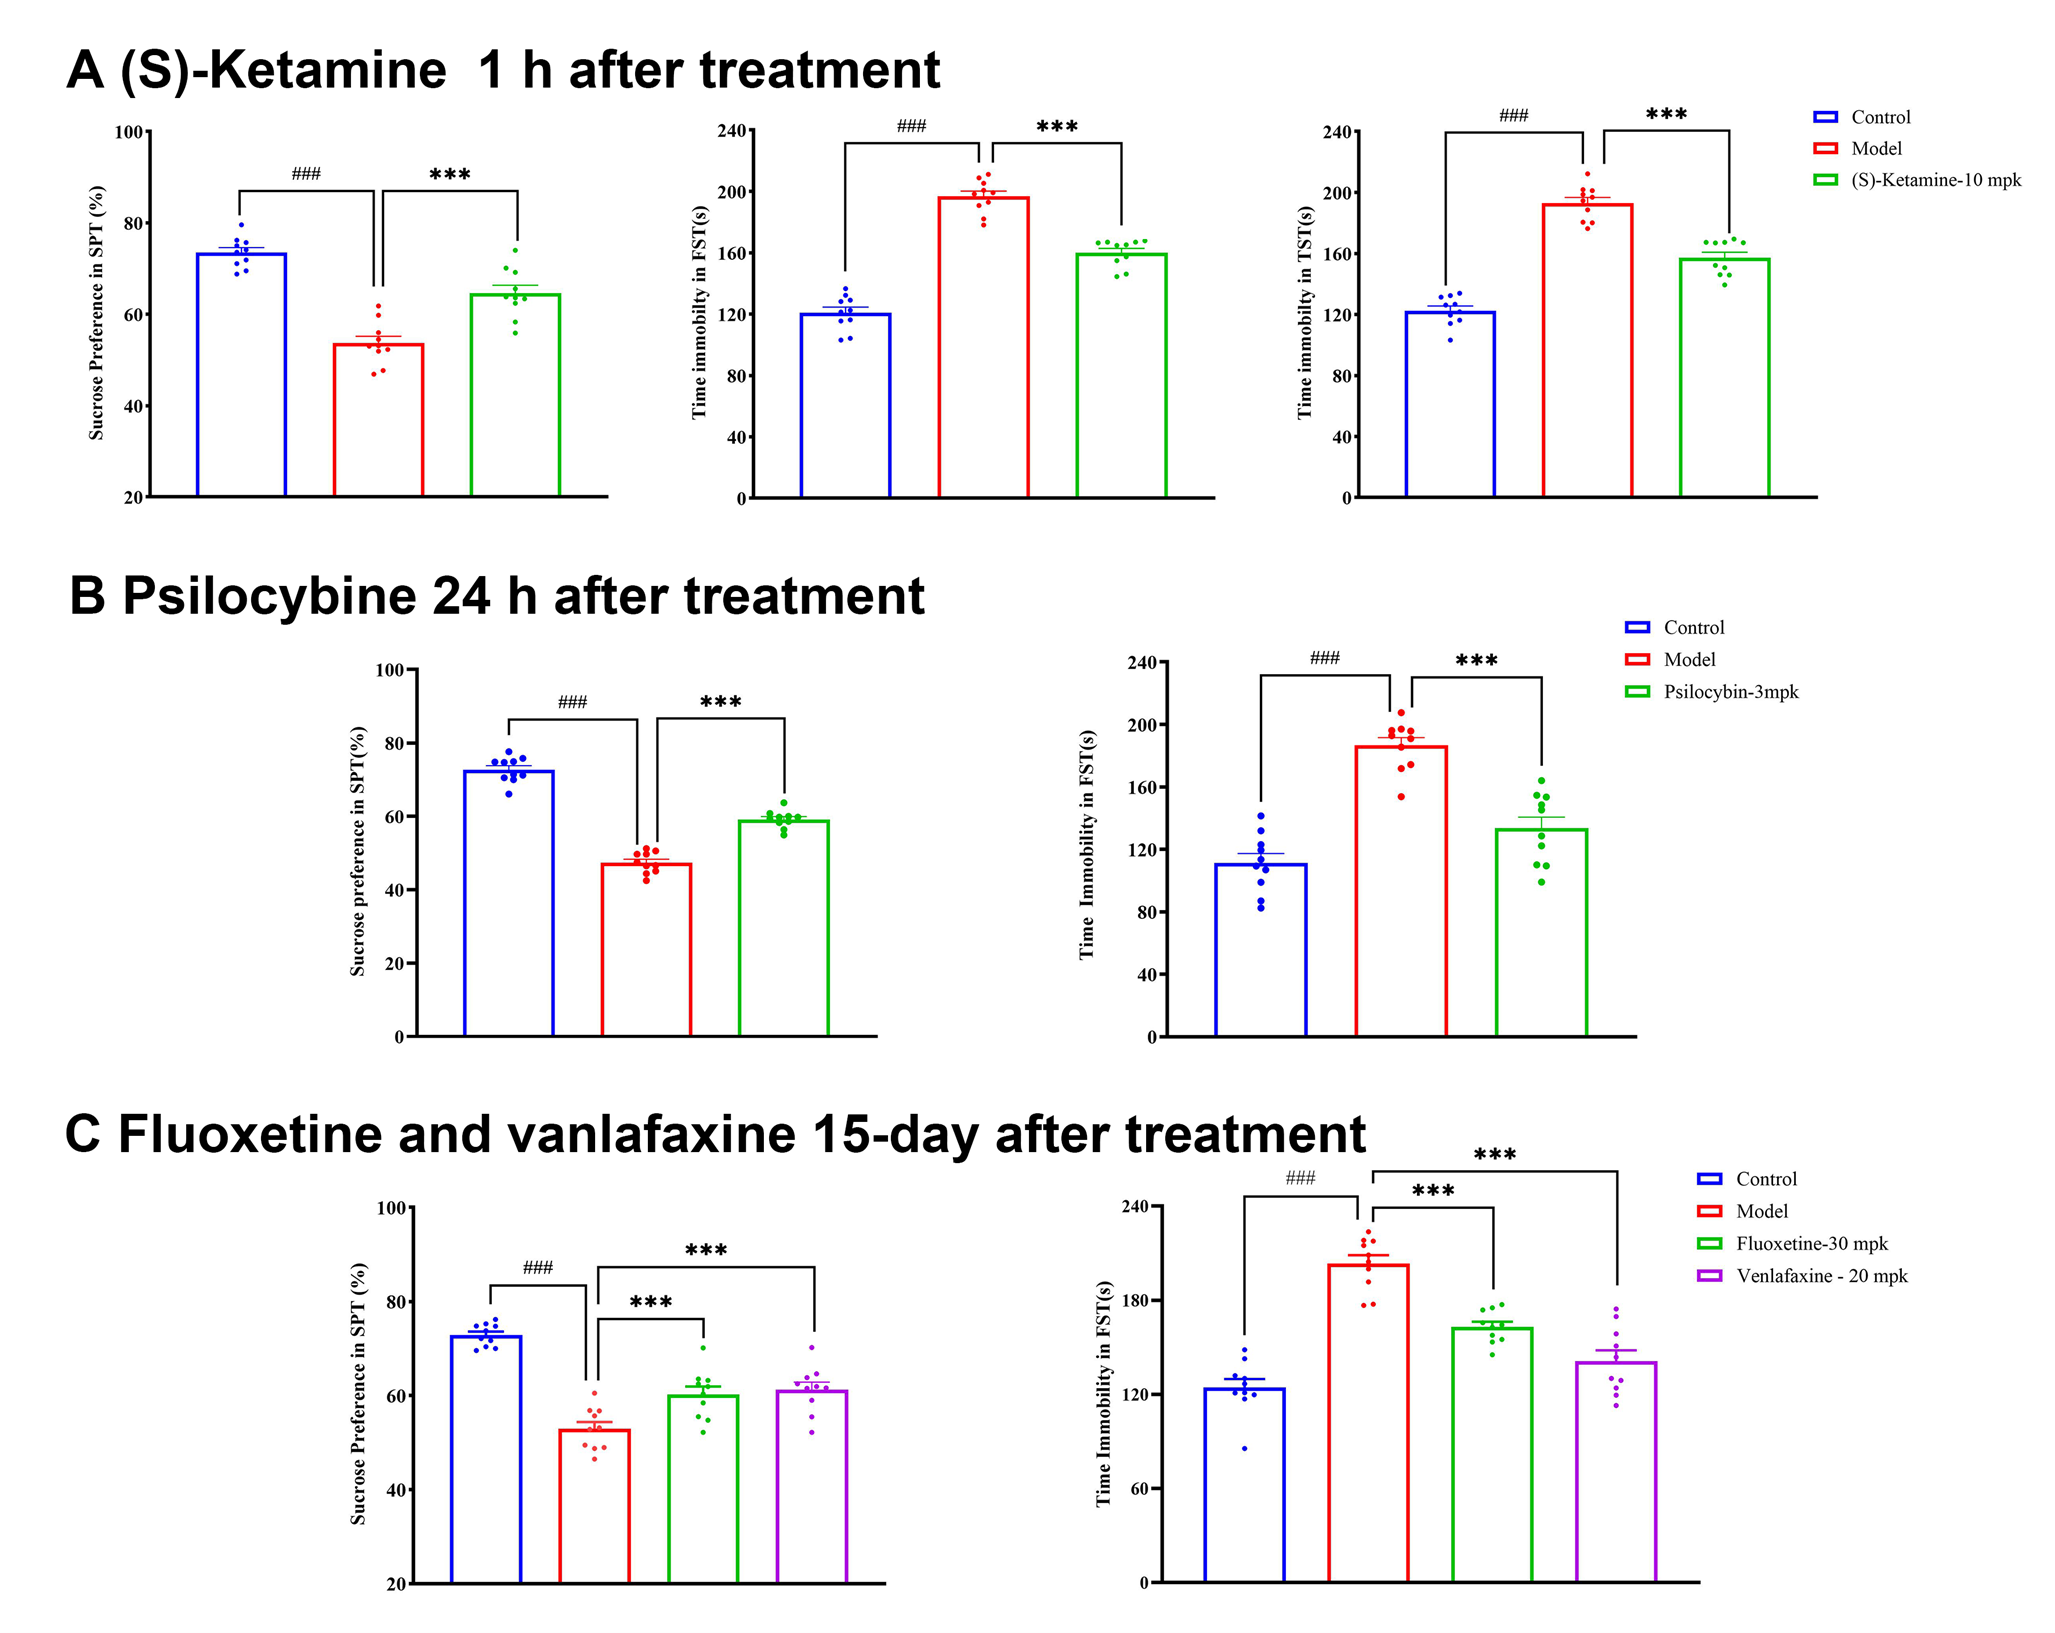
Figure 3. Behavioral responses to reference antidepressants in CUMS mice. (A) Sucrose preference and FST and TST immobility 1 h after (S)-ketamine (10 mg/kg). (B) Sucrose preference and FST immobility 24 h after psilocybin (3 mg/kg). (C) The same endpoints after 15 days of fluoxetine (30 mg/kg) or venlafaxine (20 mg/kg) treatment. Unstressed controls and CUMS model mice are shown as comparators. Points represent individual observations; brackets indicate the annotated group comparisons. FST, forced swim test; TST, tail suspension test.
The CUMS model group retained reduced sucrose preference and increased FST immobility at the 15-day endpoint (Figure 3C). Thus, under the present experimental conditions, the CUMS-induced depressive-like phenotype can persist for approximately two weeks after stress cessation, providing a practical window for therapeutic efficacy evaluation. This is consistent with chronic variable-stress research reporting anhedonia at two weeks after stress, although the duration depends on the induction protocol and endpoint.[13]
Chronic stress can alter neuronal plasticity and glial function. Mechanistic characterization provides a biological framework for interpreting behavioral responses and identifying endpoints for subsequent target-focused studies.[7,14–16]
Brain-derived neurotrophic factor (BDNF) activates the receptor tyrosine kinase TrkB and influences neuronal plasticity through downstream signaling modules, including phospholipase C gamma 1 (PLCγ1). Experimental studies have linked antidepressant responses to TrkB activation and TrkB–PLCγ1 coupling, providing a rationale for measuring BDNF and associated phosphoprotein signals.[7]
Figure 4A summarizes the assessment strategy. BDNF concentrations were measured by ELISA, and p-TrkB, p-PLCγ1, and p-CREB signals were assessed by immunofluorescence in the prefrontal cortex (PFC) and hippocampus. Compared with controls, CUMS mice showed significantly lower BDNF concentrations (Figure 4B) and lower intensities of all three phosphoprotein signals in both regions (Figure 4C–E). Fluoxetine (30 mg/kg) significantly increased each readout relative to the model group, consistent with partial restoration of neurotrophic signaling markers.
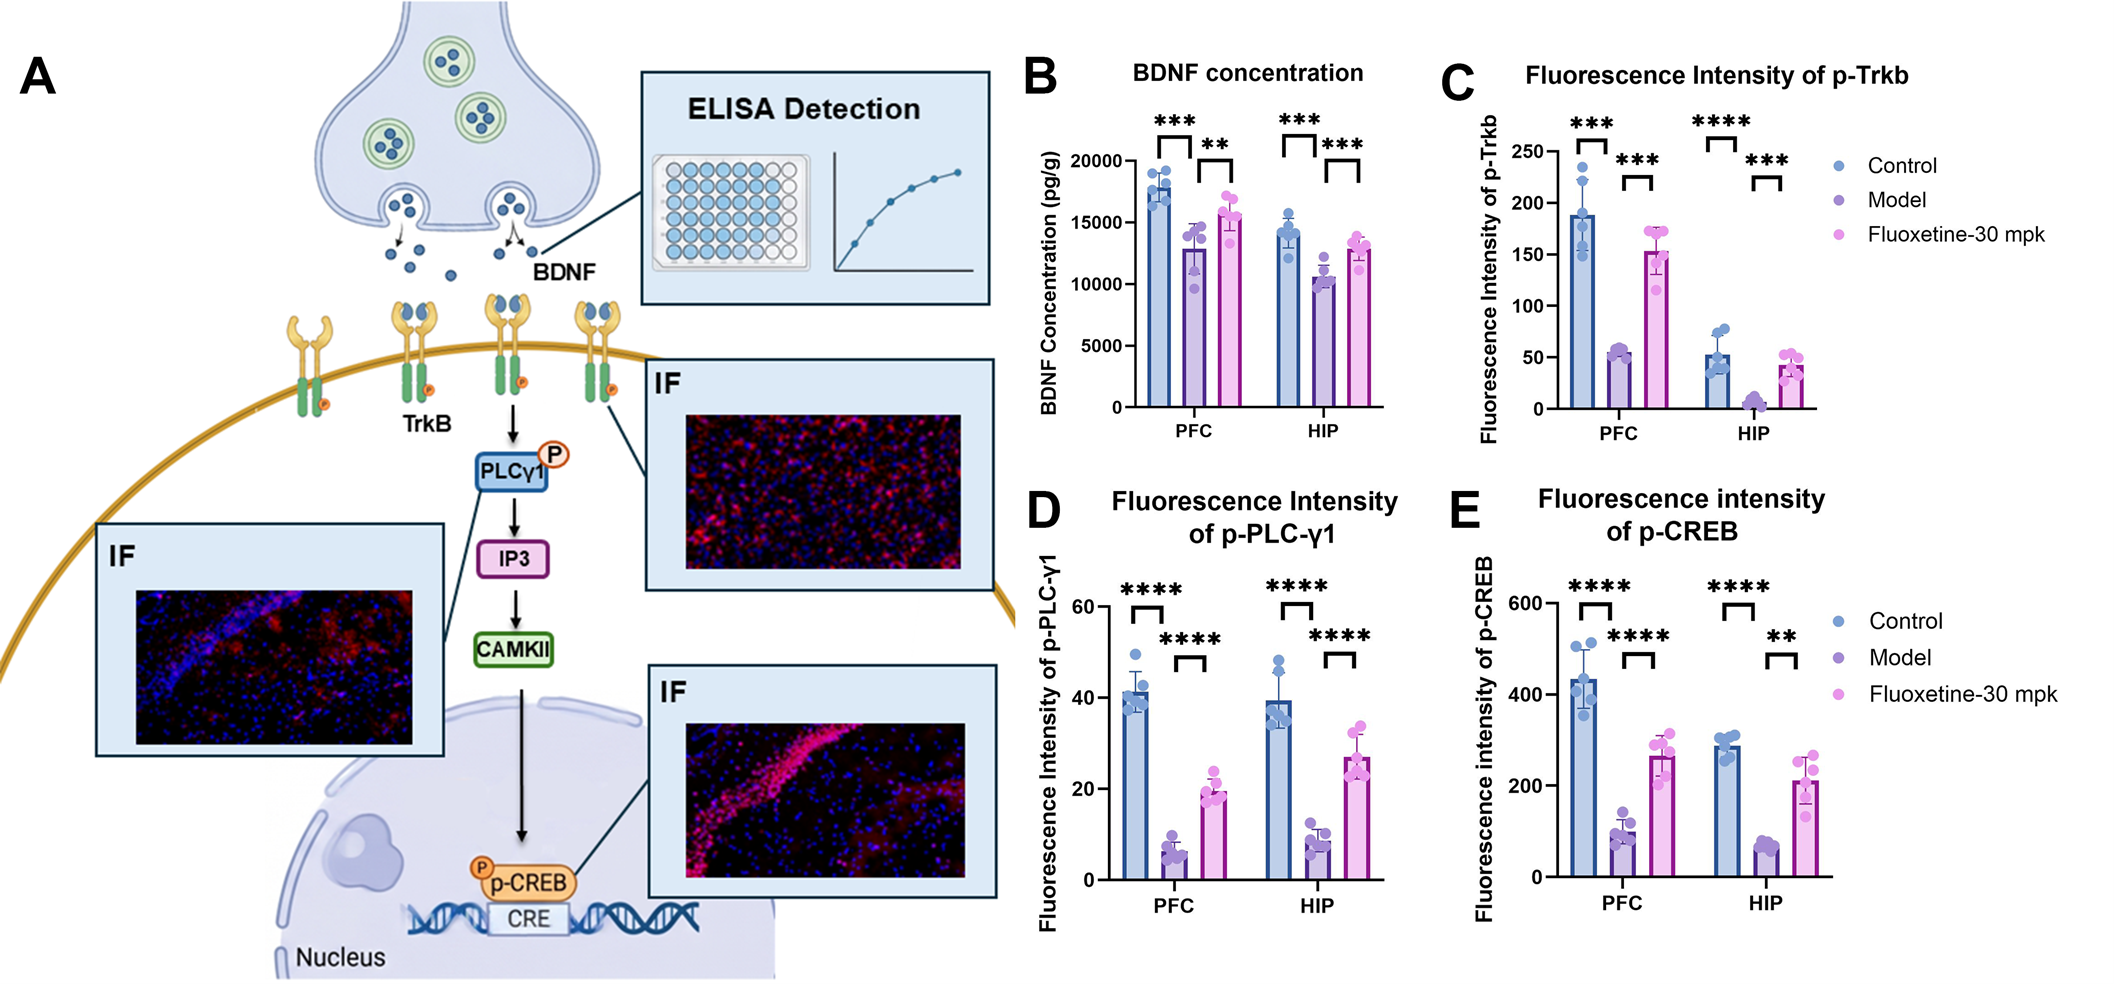
Figure 4. BDNF–TrkB-associated signaling in CUMS mice. (A) Signaling schematic and ELISA and immunofluorescence (IF) readouts. (B) BDNF concentration measured by ELISA. (C–E) IF intensities of p-TrkB, p-PLCγ1, and p-CREB, respectively. Measurements are shown for the prefrontal cortex (PFC) and hippocampus (HIP) in control, CUMS model, and fluoxetine-treated CUMS groups (30 mg/kg). Points represent individual observations; brackets indicate the annotated comparisons. BDNF, brain-derived neurotrophic factor; PLCγ1, phospholipase C gamma 1; CREB, cAMP response element-binding protein; p-, phosphorylated.
Astrocytes contribute to the maintenance of neuronal function, and experimental glial ablation in rat PFC has produced behavioral deficits resembling those induced by chronic stress.[14] Microglial responses are also dynamic: a mouse chronic-stress study identified early activation followed by region-dependent reductions in microglial number and function.[15] These findings support examining glial-associated endpoints alongside neuronal signaling.
Glial-associated markers were assessed by immunofluorescence (Figure 5A). Compared with controls, CUMS mice showed significantly fewer GFAP-positive profiles in hippocampal CA1 and the dentate gyrus (DG; Figure 5B). The percentage of CD206-positive/Iba1-positive cells among Iba1-positive cells was also significantly lower in the PFC (Figure 5C). These findings identify marker-defined changes in astrocytic and myeloid-cell-associated endpoints; the markers alone do not establish cell loss or a specific functional state.
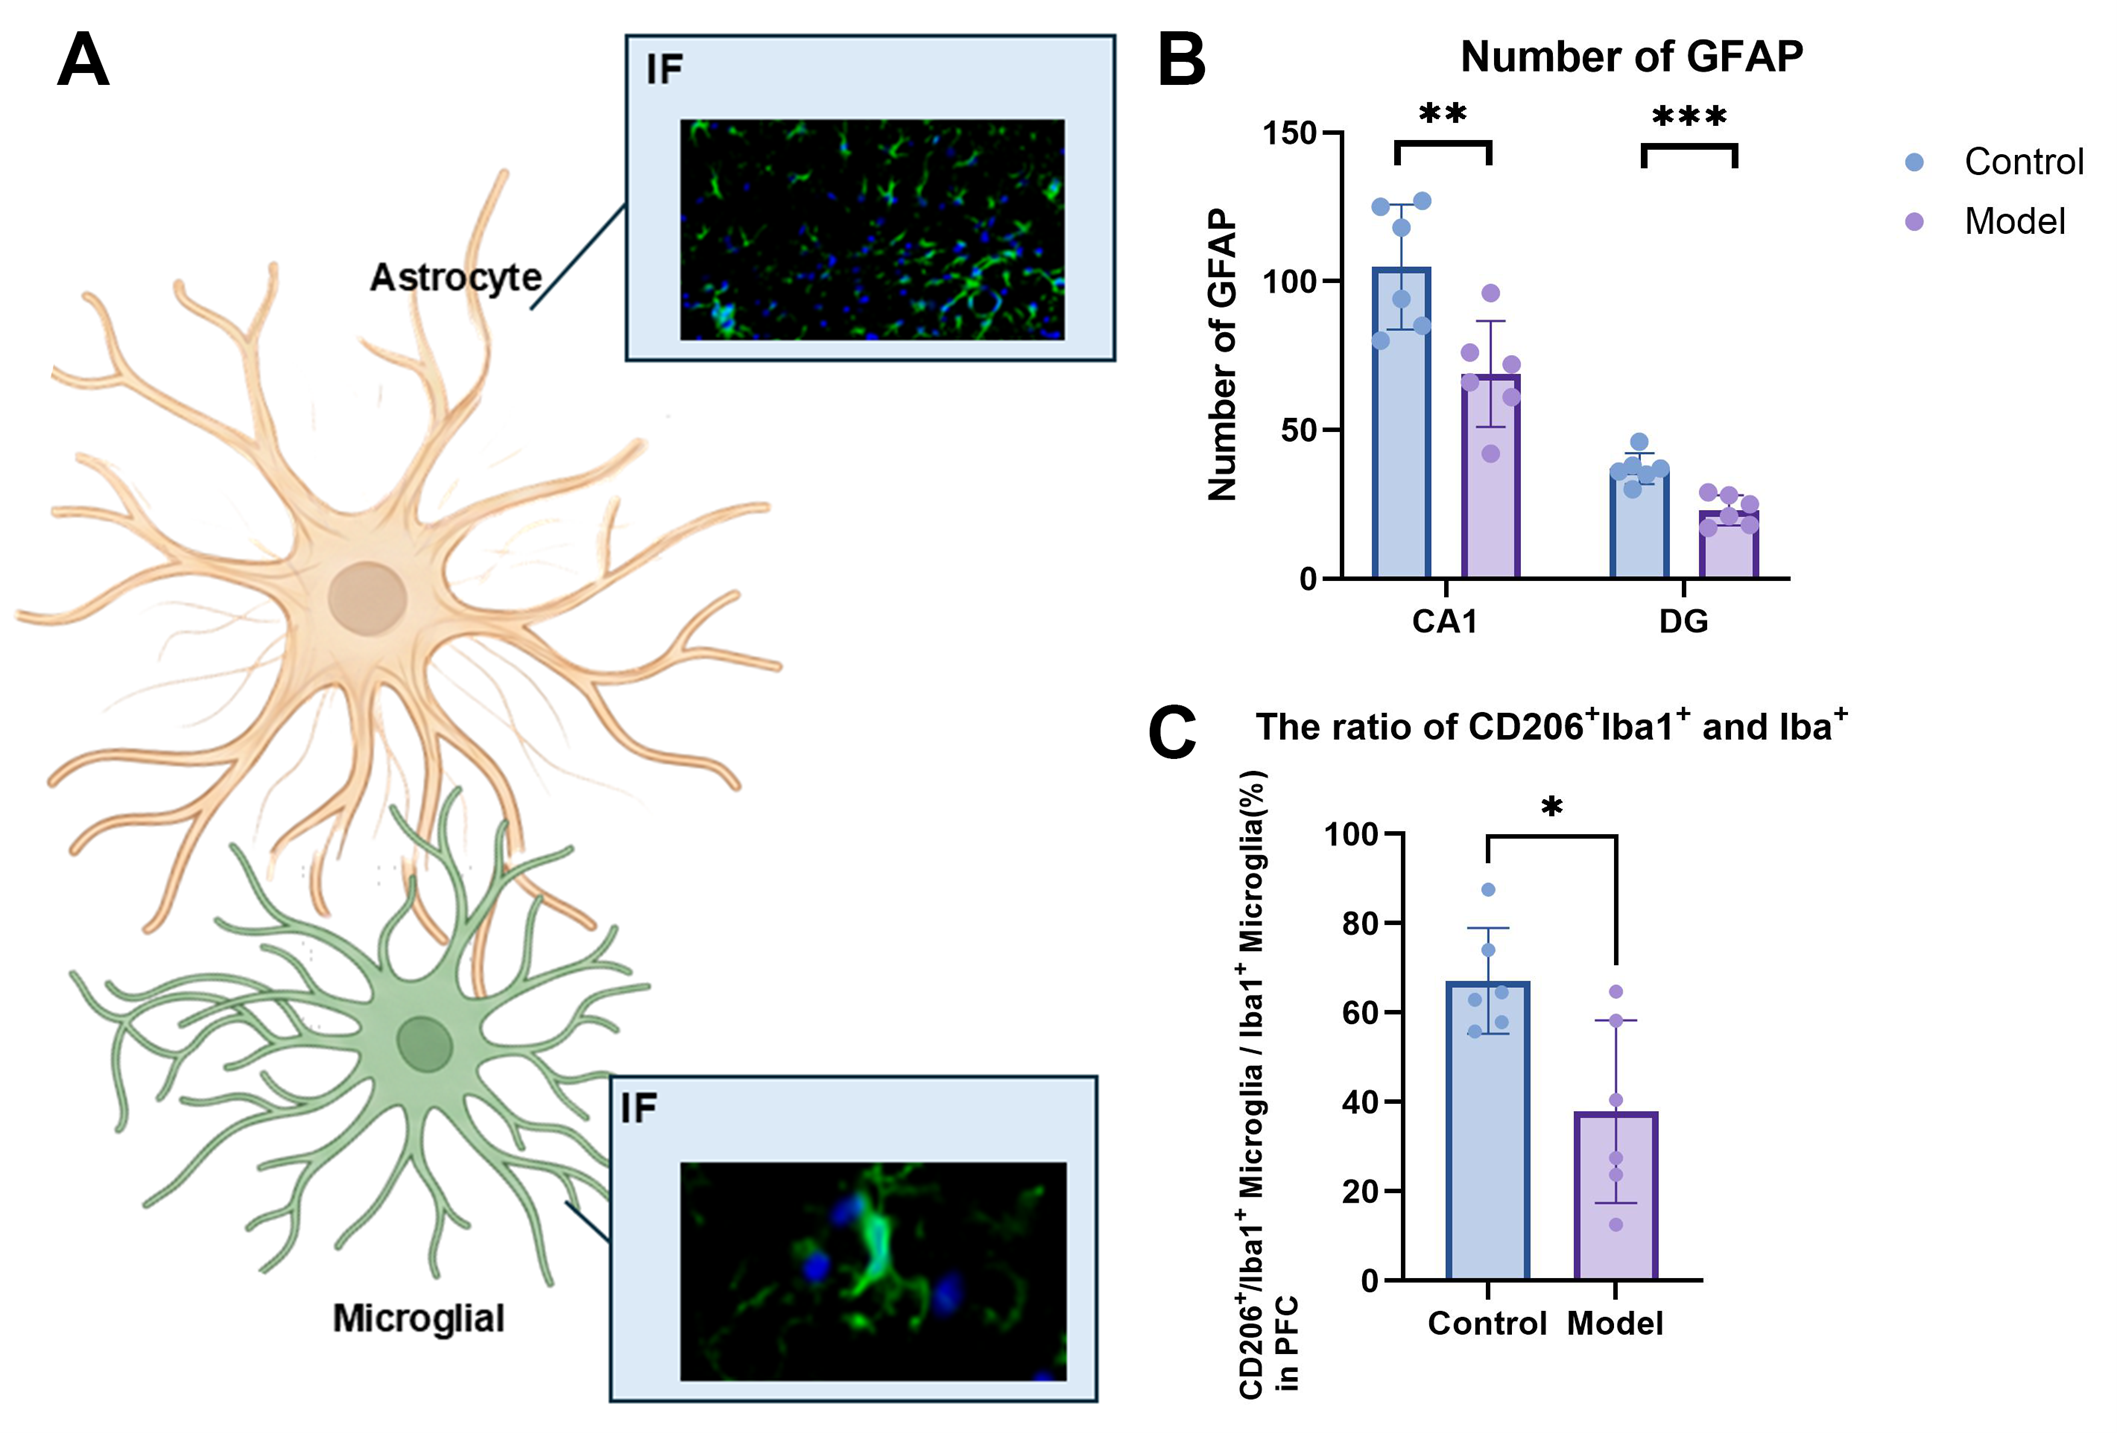
Figure 5. Glial-associated changes in CUMS mice. (A) Astrocyte and microglial schematics with IF images. (B) GFAP-positive profiles in hippocampal CA1 and the dentate gyrus (DG). (C) Percentage of CD206-positive/Iba1-positive cells among Iba1-positive cells in the prefrontal cortex (PFC). Control and CUMS model groups are compared. Points represent individual observations; brackets indicate the annotated comparisons. GFAP, glial fibrillary acidic protein; Iba1, ionized calcium-binding adapter molecule 1; CD206, mannose receptor; IF, immunofluorescence.
Dendritic spines provide structural sites for many excitatory synapses. Their density and morphology offer complementary measures of synaptic plasticity. In a rat chronic-stress study, reduced PFC spine density and synaptic function were reversed by ketamine, supporting the use of spine measurements alongside behavioral endpoints.[16]
Spine morphologies are illustrated in Figure 6A. In this analysis, mushroom and stubby spines were classified as mature spines. Quantification showed significantly lower total and mature dendritic spine counts in both the PFC and hippocampus in CUMS mice than in controls (Figure 6B). Fluoxetine (30 mg/kg) significantly increased both counts in the PFC. Hippocampal counts were numerically higher after treatment, but the differences from the model group were not significant.
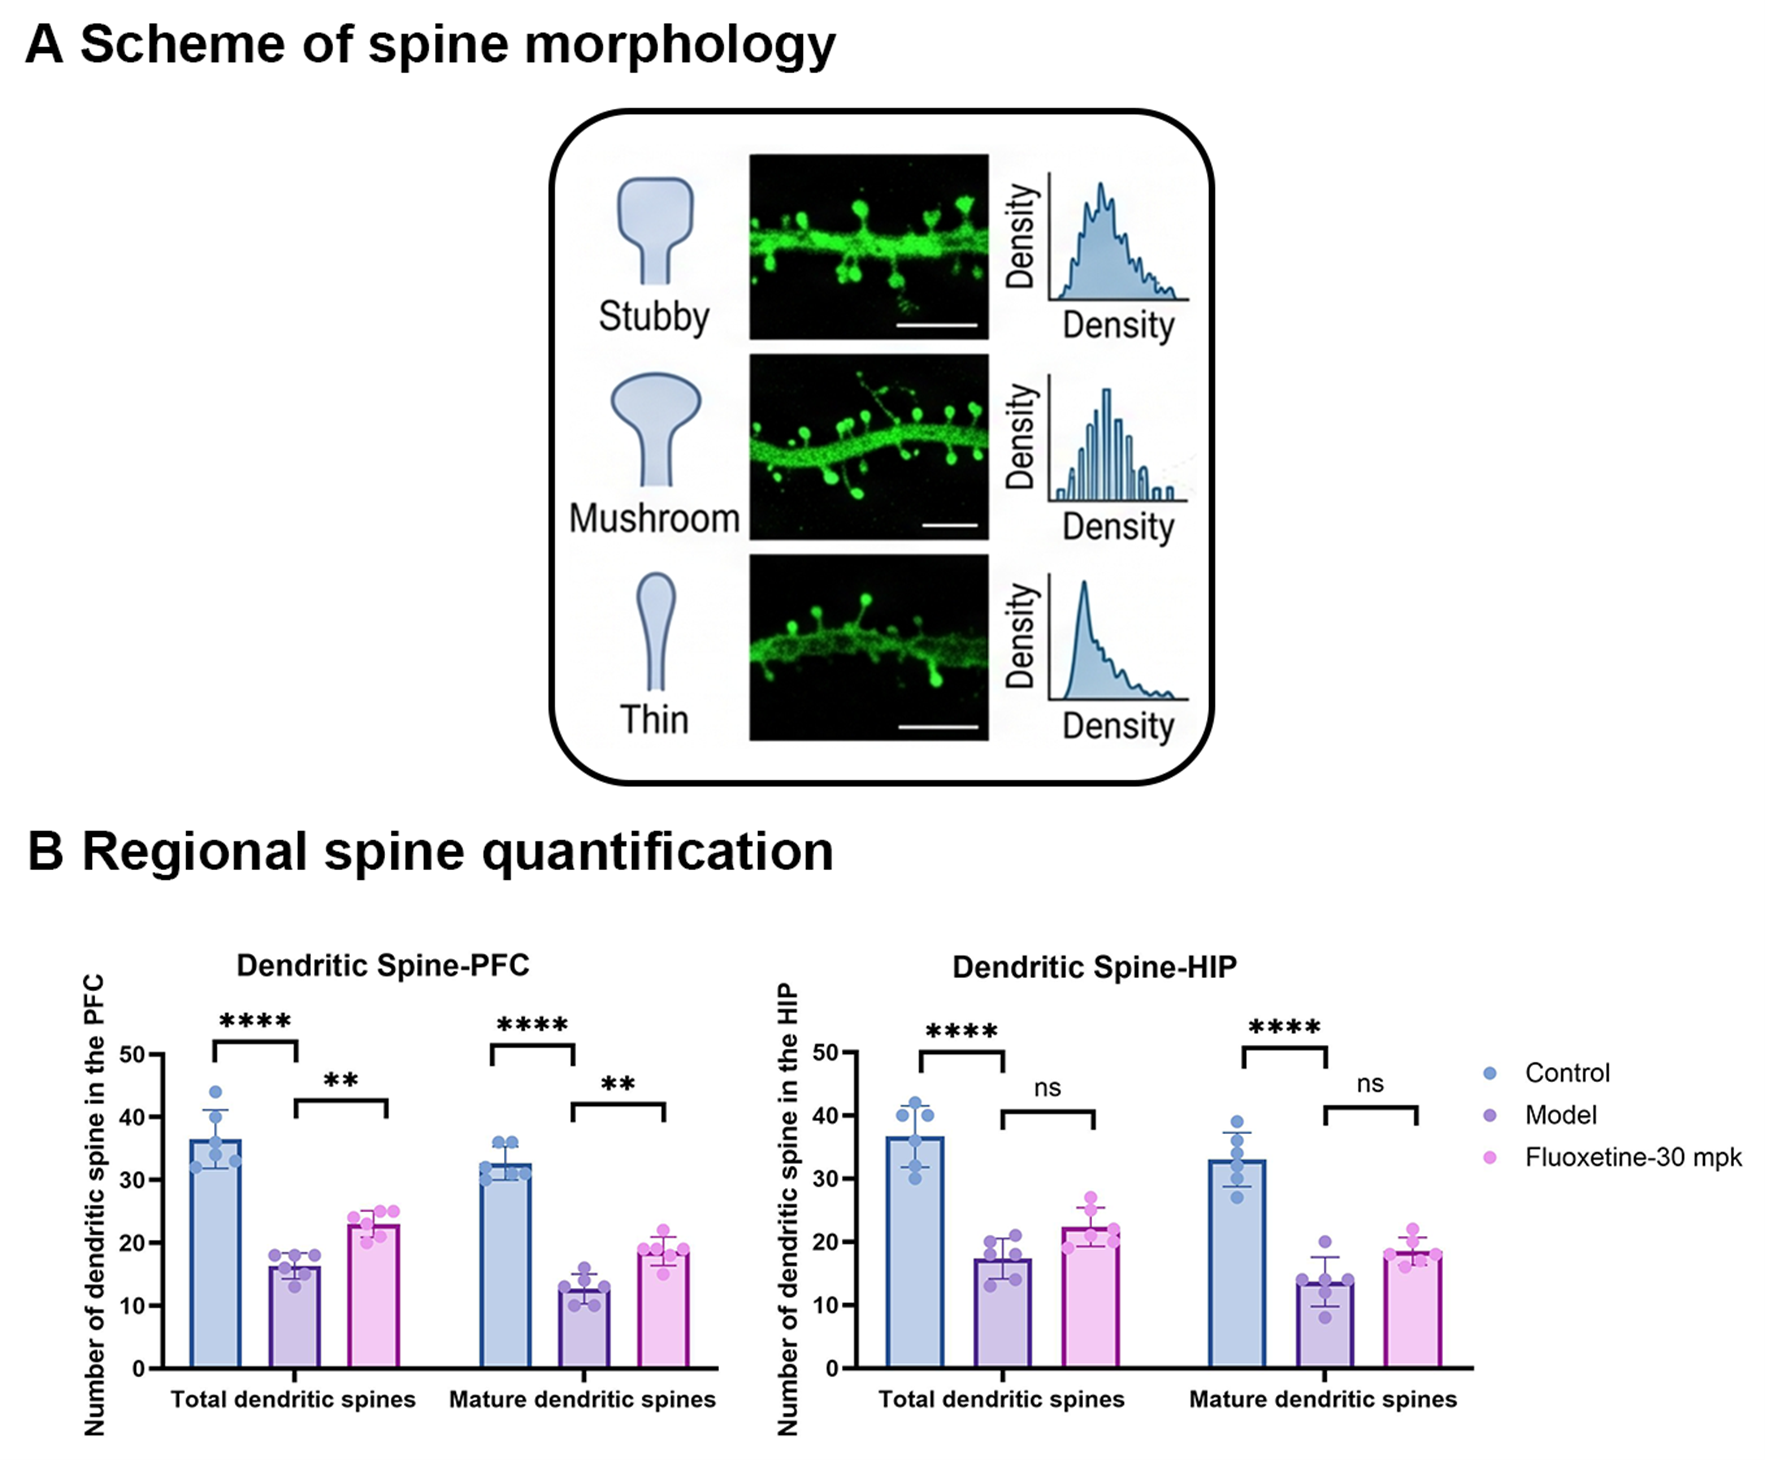
Figure 6. Dendritic spine morphology and regional quantification in CUMS mice. (A) Stubby, mushroom, and thin spine schematics, corresponding microscopy images, and density illustrations. (B) Total and mature dendritic spine counts in the prefrontal cortex (PFC) and hippocampus (HIP) in control, CUMS model, and fluoxetine-treated CUMS groups (30 mg/kg). Points represent individual observations; brackets indicate the annotated comparisons. ns, not significant.
Structural magnetic resonance imaging (MRI) quantifies regional brain anatomy and complements molecular and cellular measurements. A mouse CUMS study demonstrated stress-associated changes in corticolimbic anatomy, supporting region-specific volumetry as an additional model-characterization endpoint.[17]
MRI volumetry (Figure 7A) showed significantly lower left-sided and total gray matter volumes in the PFC and temporal cortex in CUMS mice than in controls (Figure 7B). Fluoxetine (30 mg/kg) significantly increased left-sided volumes in both regions and total PFC volume. All right-sided comparisons and the total temporal cortical treatment comparison were not significant.
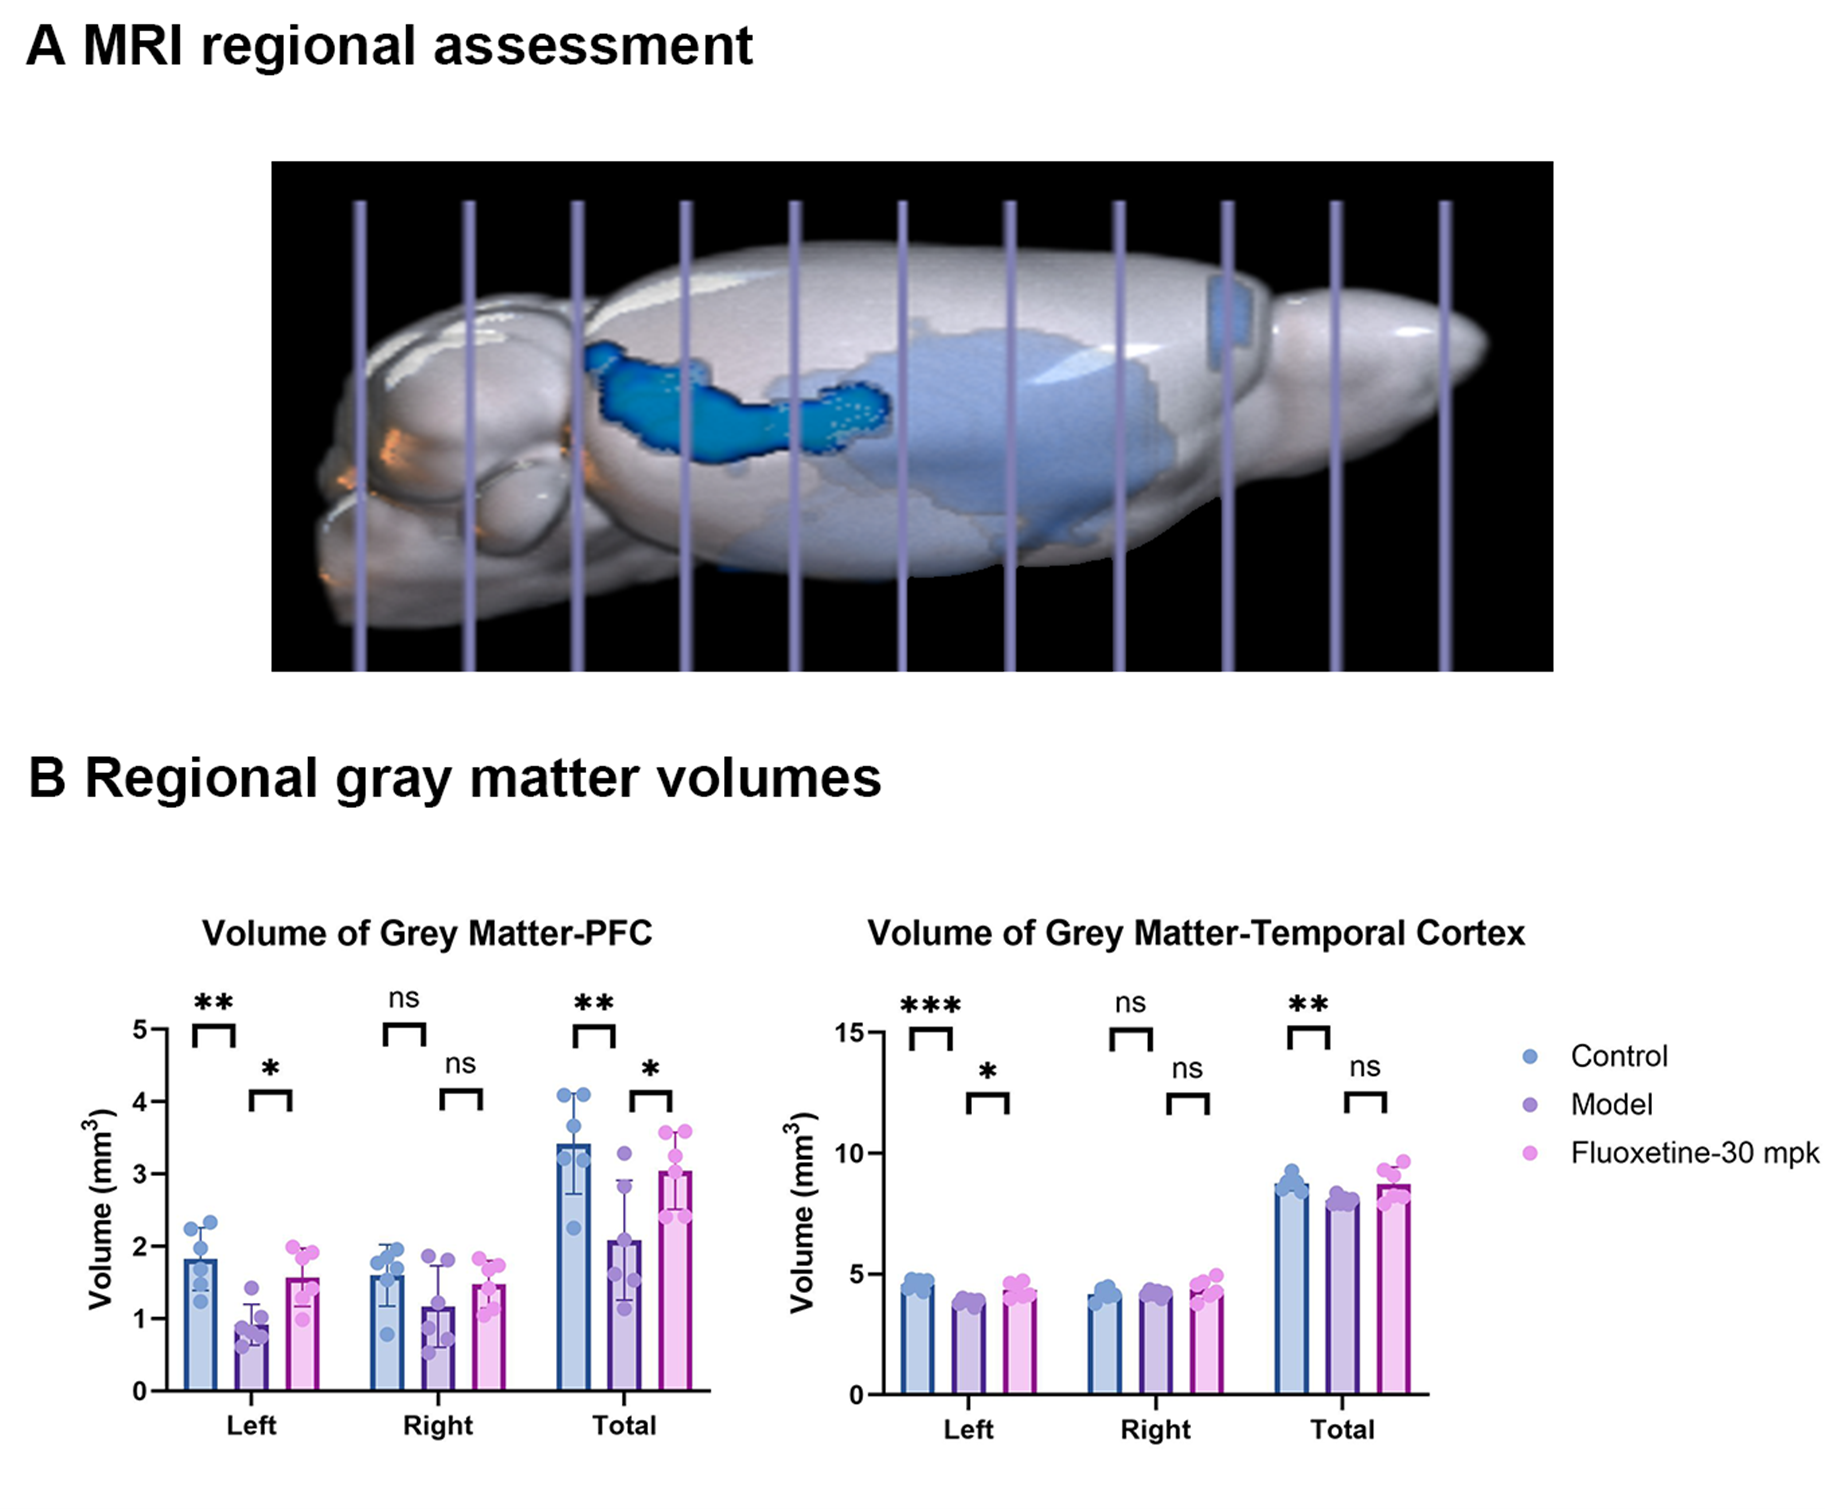
Figure 7. Regional MRI volumetry in CUMS mice. (A) Illustration of regional brain assessment. (B) Left, right, and total gray matter volumes (mm³) in the prefrontal cortex (PFC) and temporal cortex in control, CUMS model, and fluoxetine-treated CUMS groups (30 mg/kg). Points represent individual observations; brackets indicate the annotated comparisons. MRI, magnetic resonance imaging; ns, not significant.
This CUMS case integrates a defined induction protocol with TST-based enrollment and balanced pretreatment allocation. Responses to rapid-acting reference compounds and 15-day antidepressant treatment demonstrate pharmacological responsiveness, while persistent model-group deficits support an approximately two-week post-stress efficacy window under the present conditions. Neurotrophic signaling, glial-associated markers, dendritic spines, and MRI provide complementary endpoints for characterizing treatment responses and planning further mechanism-of-action studies.
1. Burstein O, Doron R. The Unpredictable Chronic Mild Stress Protocol for Inducing Anhedonia in Mice. Journal of Visualized Experiments. 2018;(140):58184. doi:10.3791/58184.
2. Golden SA, Covington HE III, Berton O, Russo SJ. A standardized protocol for repeated social defeat stress in mice. Nature Protocols. 2011;6:1183–1191. doi:10.1038/nprot.2011.361.
3. Landgraf D, Long J, Der-Avakian A, Streets M, Welsh DK. Dissociation of Learned Helplessness and Fear Conditioning in Mice: A Mouse Model of Depression. PLOS ONE. 2015;10(4):e0125892. doi:10.1371/journal.pone.0125892.
4. Hodes GE, et al. Individual differences in the peripheral immune system promote resilience versus susceptibility to social stress. Proceedings of the National Academy of Sciences USA. 2014;111(45):16136–16141. doi:10.1073/pnas.1415191111.
5. Berton O, et al. Essential role of BDNF in the mesolimbic dopamine pathway in social defeat stress. Science. 2006;311(5762):864–868. doi:10.1126/science.1120972.
6. Maeng S, et al. Cellular mechanisms underlying the antidepressant effects of ketamine: role of alpha-amino-3-hydroxy-5-methylisoxazole-4-propionic acid receptors. Biological Psychiatry. 2008;63(4):349–352. doi:10.1016/j.biopsych.2007.05.028.
7. Casarotto PC, et al. Antidepressant drugs act by directly binding to TRKB neurotrophin receptors. Cell. 2021;184(5):1299–1313.e19. doi:10.1016/j.cell.2021.01.034.
8. Picard K, et al. Microglial-glucocorticoid receptor depletion alters the response of hippocampal microglia and neurons in a chronic unpredictable mild stress paradigm in female mice. Brain, Behavior, and Immunity. 2021;97:423–439. doi:10.1016/j.bbi.2021.07.022.
9. Shao LX, et al. Psilocybin induces rapid and persistent growth of dendritic spines in frontal cortex in vivo. Neuron. 2021;109(16):2535–2544.e4. doi:10.1016/j.neuron.2021.06.008.
10. Nollet M. Models of depression: Unpredictable chronic mild stress in mice. Current Protocols. 2021;1(8):e208. doi:10.1002/cpz1.208.
11. Pothion S, Bizot JC, Trovero F, Belzung C. Strain differences in sucrose preference and in the consequences of unpredictable chronic mild stress. Behavioural Brain Research. 2004;155(1):135–146. doi:10.1016/j.bbr.2004.04.008.
12. Steru L, Chermat R, Thierry B, Simon P. The tail suspension test: A new method for screening antidepressants in mice. Psychopharmacology. 1985;85(3):367–370. doi:10.1007/BF00428203.
13. Cline BH, et al. Lasting downregulation of the lipid peroxidation enzymes in the prefrontal cortex of mice susceptible to stress-induced anhedonia. Behavioural Brain Research. 2015;276:118–129. doi:10.1016/j.bbr.2014.04.037.
14. Banasr M, Duman RS. Glial loss in the prefrontal cortex is sufficient to induce depressive-like behaviors. Biological Psychiatry. 2008;64(10):863–870. doi:10.1016/j.biopsych.2008.06.008.
15. Kreisel T, et al. Dynamic microglial alterations underlie stress-induced depressive-like behavior and suppressed neurogenesis. Molecular Psychiatry. 2014;19(6):699–709. doi:10.1038/mp.2013.155.
16. Li N, et al. Glutamate N-methyl-D-aspartate receptor antagonists rapidly reverse behavioral and synaptic deficits caused by chronic stress exposure. Biological Psychiatry. 2011;69(8):754–761. doi:10.1016/j.biopsych.2010.12.015.
17. Nikolova YS, et al. Shifting priorities: Highly conserved behavioral and brain network adaptations to chronic stress across species. Translational Psychiatry. 2018;8:26. doi:10.1038/s41398-017-0083-5.
ICE Bioscience. Model yields and case-study results derive from the internal dataset. Literature citations provide methodological and mechanistic context.
PREV:Translational Profiling of the AR–BRD4 R...
NEXT:There's no more
2026-11-03
2026-08-20
2026-07-03
2026-05-22
We value your inquiries and are here to provide you with tailored solutions for your drug discovery and development needs. Whether you have questions, require more information, or are interested in discussing potential collaborations, our team of experts is just a message away.
Feel free to reach out to us.

Address: Bldg 16, Yd 18, Kechuang 13th St, Etown, Tongzhou Dist, Beijing, 100176, China
Email: marketing@ice-biosci.com
Tel:+86-10-67809840


Get a quote

Go top